SNOOS: Small Near-Earth Object Observing System
Home Definitions Problem Statement Project Development Deliverables Team Members References
Project Development Process
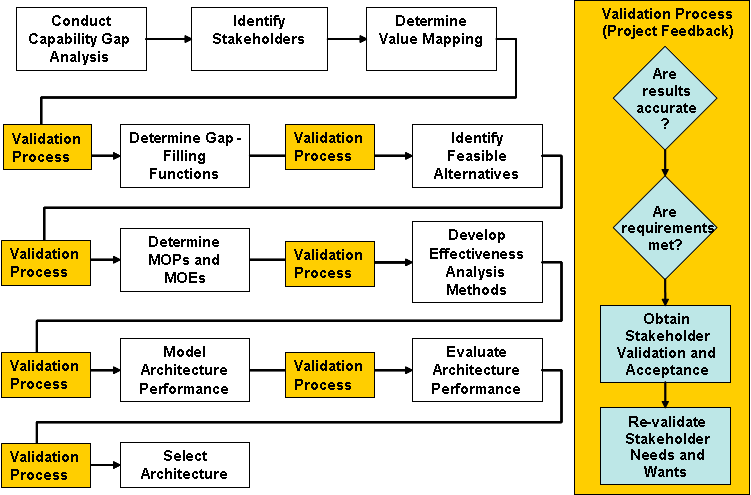
The project team chose the following development process for the SNOOS project. This project is not a typical system development project in that there is a large amount of research and analysis involved, as opposed to just the creation of a system. Because of this, a traditional methodology did not make sense. However, it is still critical that the team have multiple feedback loops to ensure that the stakeholders needs are met. Due to the large amount of analysis required for this project, feedback loops are needed in case the design requires updates as well. Feedback loops are designated by the Validation Process boxes in the process. This process is shown in detail on the right side of the picture. The validation process includes checks to ensure that stakeholder needs and requirements are met, results are accurate, and all deliverables are submitted.
Function Decomposition
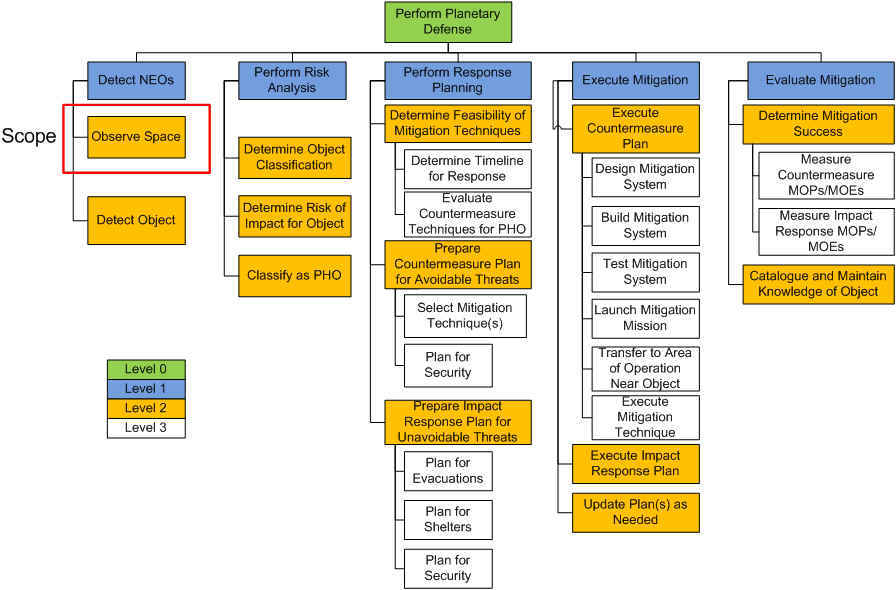
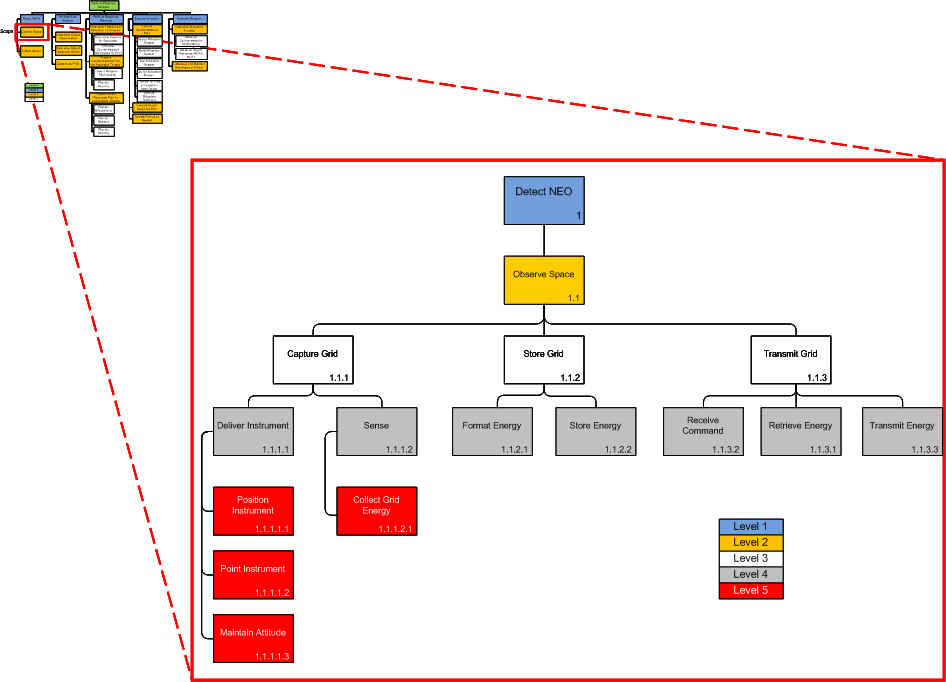
The team decomposed the entire Planetary Defense mission. Based on the stakeholder value mapping, the team determined that the area of scope would include the observation of Near Earth Objects (NEOs). The scope is highlighted by the red box in the function decomposition diagram below.
System of Systems View
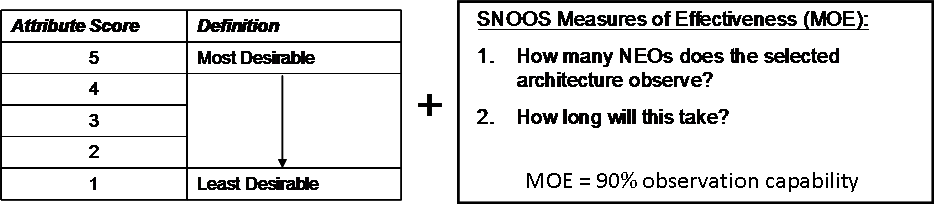
System Alternatives Evaluation Method
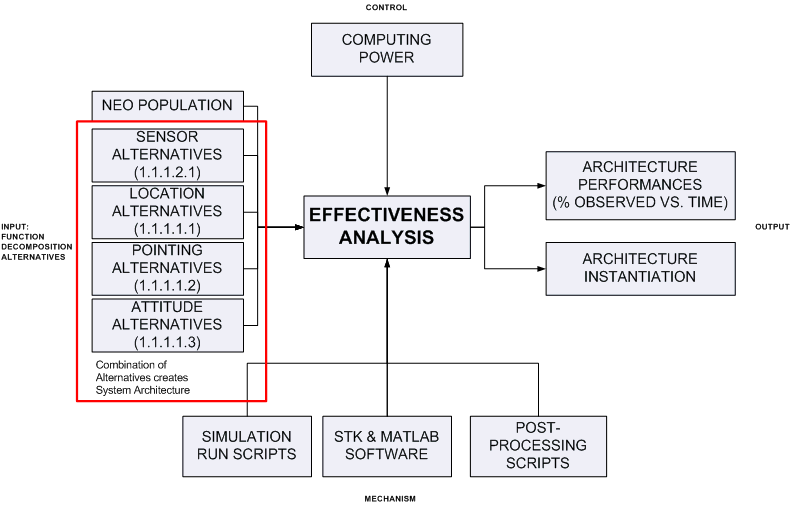
System Architecture for Effectiveness Analysis3.
The following diagram shows the inputs, control, outputs, and mechanisms associated with the SNOOS project.
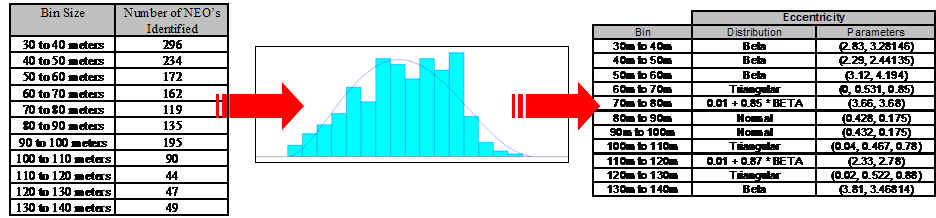
NEO Population Modeling3.
Process:
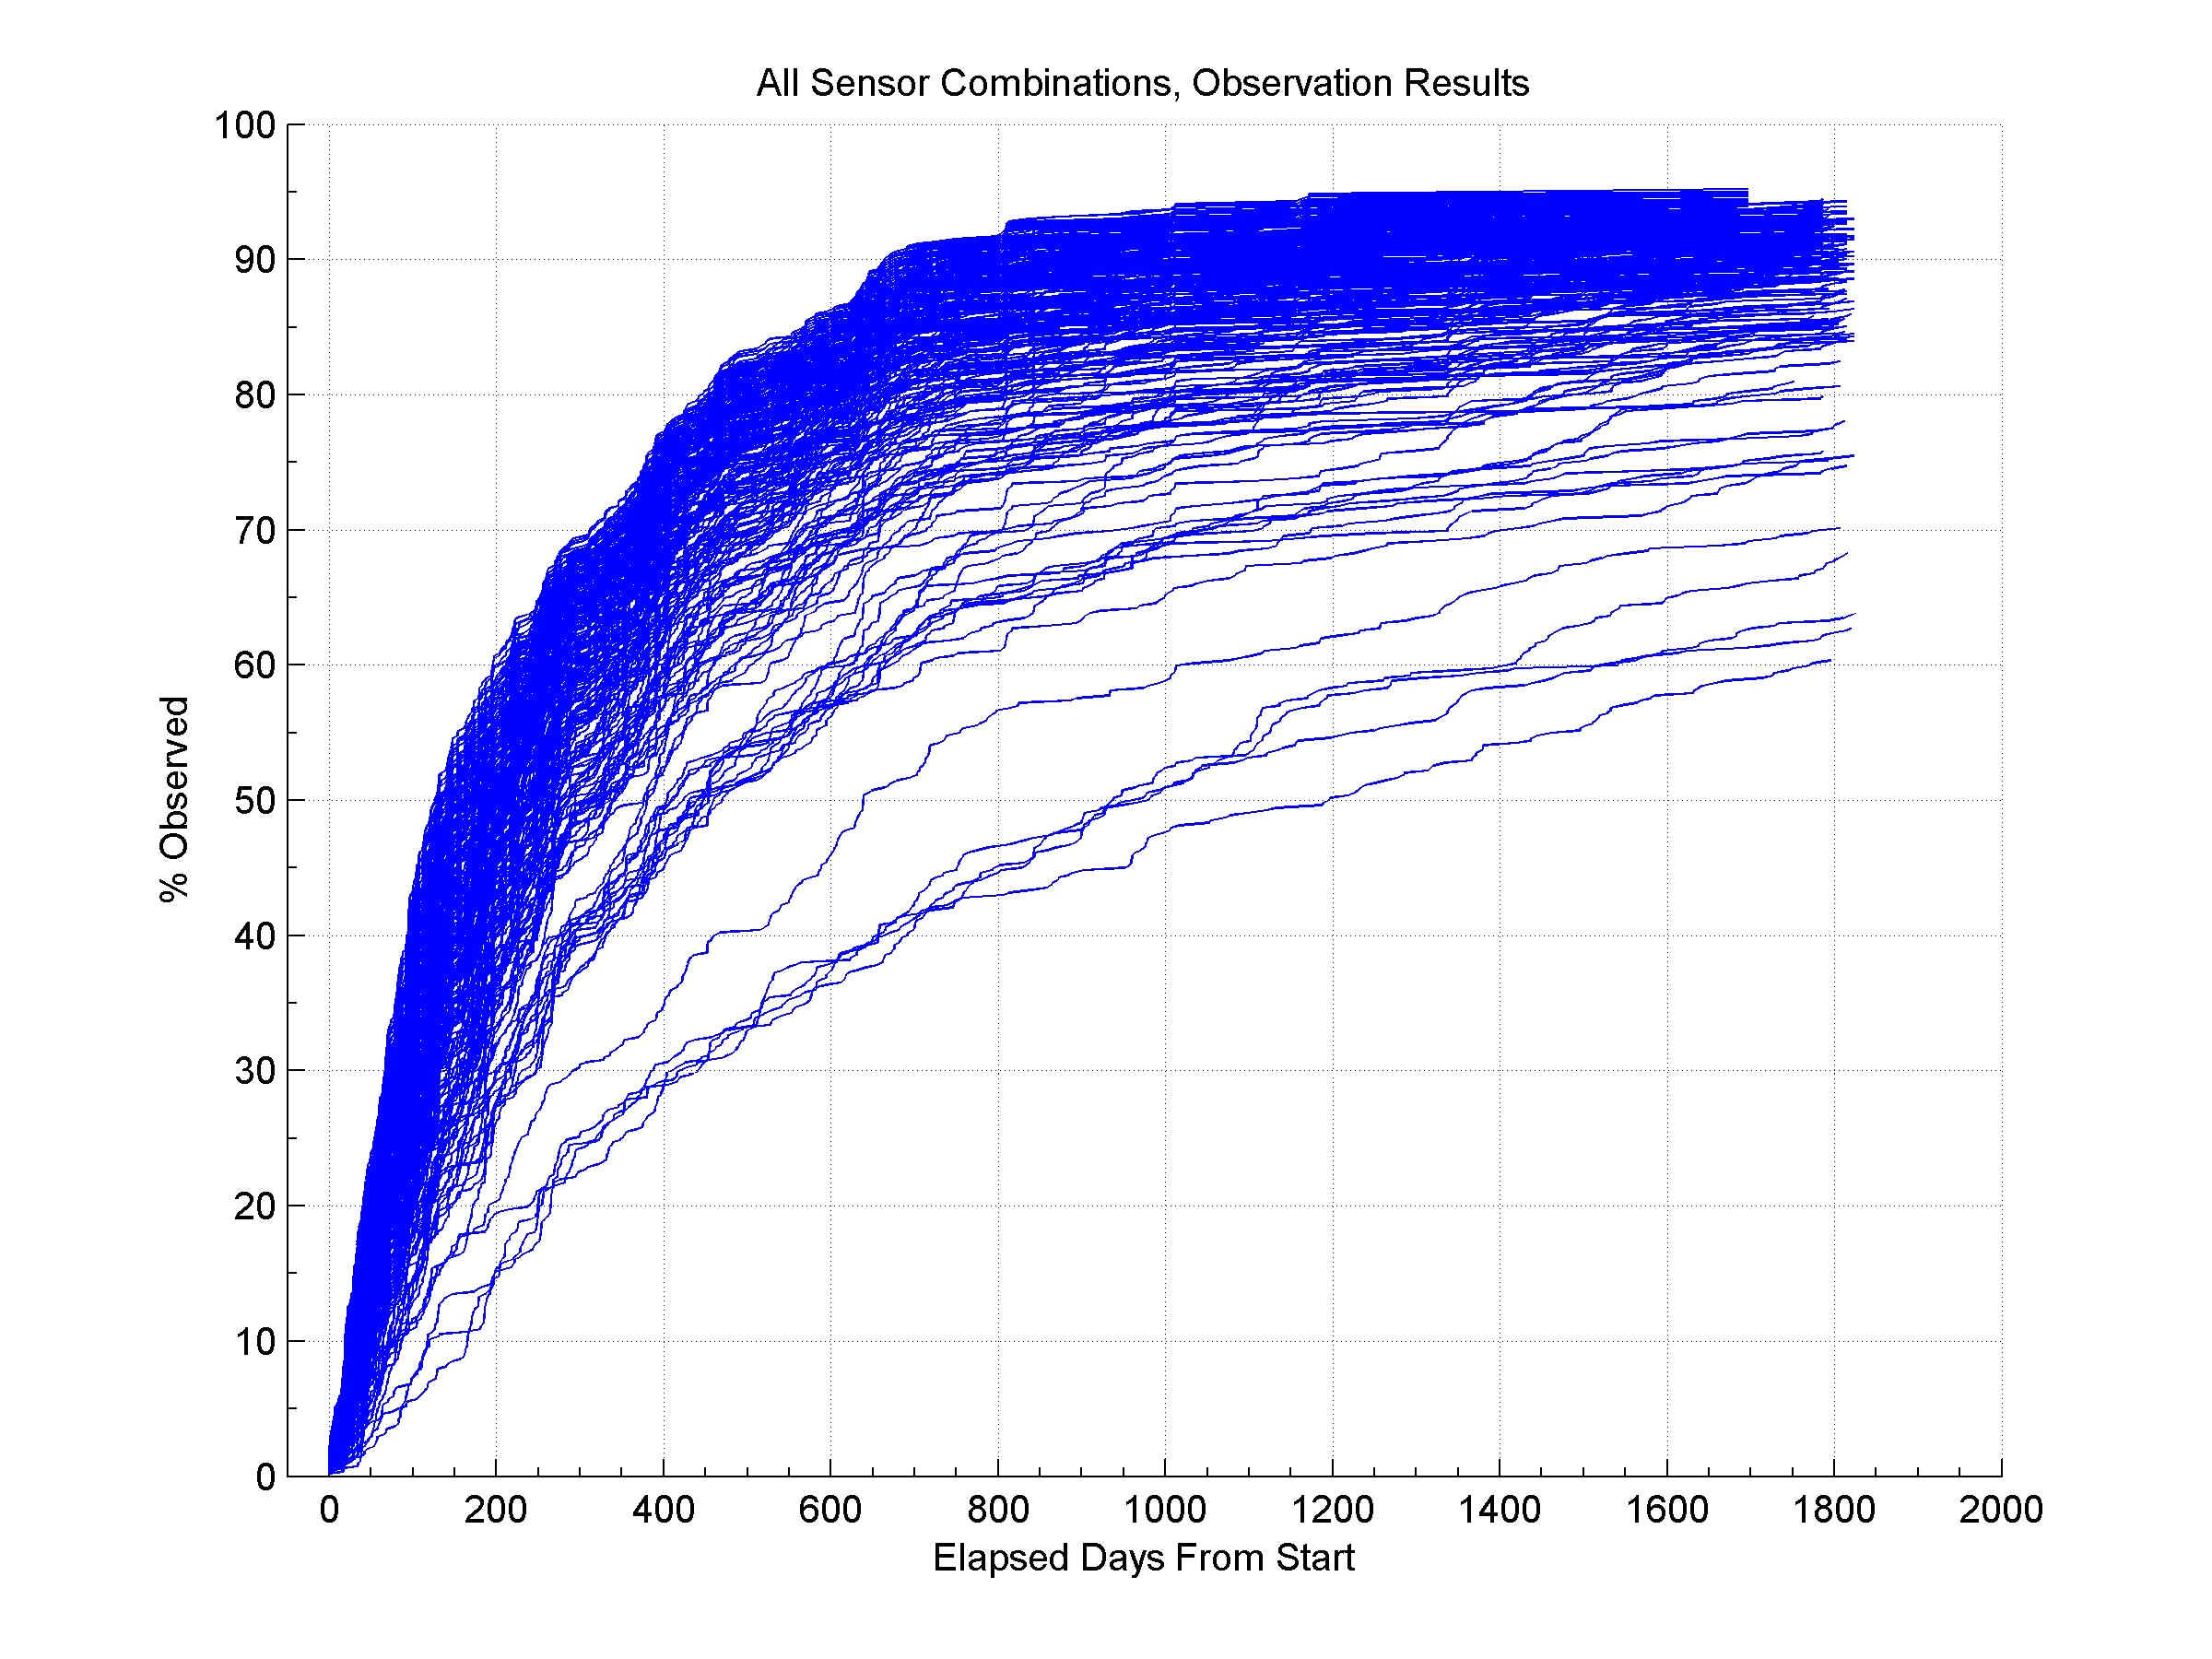
Performance Curves
After running the STK model for all 255 cases, which evaluated the performance of all combinations between 1 and 8 sensors, the following observation performance curves were obtained. This graph shows the observation rates achieved for each case over a 5 year period.
Instantiated Architecture
The SNOOS Team evaluated all architectures that met the 90% Measure of Effectiveness goal and determined that the following architecture was the most effective based on observation rate and cost.