Table
of Contents
4. Electric Usage Data Analysis
5. Plug-in Electric Vehicle and Charging Data
11.2.1 Code
for the restricted model
11.2.2Code
for the un-restricted model
Table
of Figures
Figure 1: Overall View (NOVEC
2011)
Figure 2: Transactions with Residential Customers
Figure 3: Electricity
Sales Sequence
Figure 4: Small Set of Classes
Figure 6: Class Diagram of CPN model
Figure 7: Summary of Overall 15 min data
Figure 8: Summary of Overall hourly data
Figure 9: Summary on Yearly data
Figure 10: DMV Historical
Data..
Figure 11: DMV Registered
Vehicles in Virginia
Figure 12: Vehicles
Registered over Time
Figure 13: CPN output
based on 7/1/10 data
Figure 14: CPN output of
% kW increase based on 7/1/10 data
Figure 15: Unrestricted
charging of 200 PEV’s vs. 250 Houses.
Figure 16: Restricted
charging of 200 PEV’s vs. 250 Houses.
Figure 18: Subpage: PHEV Level1
Figure 19: Subpage: PHEV Level2-L
Figure 20: Subpage: PHEV Level2-M
Figure 21: Subpage: PHEV Level2-H
Figure 22: Subpage: OTHER Usage Sources
Figure 24: NOVEC Yearly Electric Draw
Figure 25: All Users kW
consumption
Figure 26: Daily Circuit
Usage
Figure 27: Overall Daily Usage
Executive Summary
The Clean Team has conducted a series
of experiments to analyze the effects of Plug-in Electric Vehicles (PEVs) on
the power grid serviced by Northern Virginia Electric Cooperative (NOVEC). The team produced a Colored Petri Net (CPN)
Tools model to demonstrate the effects of PEVs’ charging at different rates on
the power grid. A NetLogo model was
created to demonstrate the effects of PEVs on the power grid in addition to
providing power back into the grid.
NOVEC provided all the customer usage data used in the analysis, while
the Clean Team interpolated and concluded their results.
The CPN Tools model was designed to
look at the architectural layout of the power circuit infrastructure and what
it would look like if PEHVs were added into the day to day consumption of
electricity by residential customers. The model was run giving a worst-case
scenario whereby each household had one PHEV that required charging on a daily
basis. The model was run to show the impact of charging at any time over a 24
hour period. The model was set up so that the number and duration of charging
could be modified to visualize different scenarios. The model was also
constructed to allow for the setting of a threshold to help render brown-out or
black-out situations. Though deterministic in nature, the model serves as a
good visualization tool for readily capturing the impacts of different levels
of PHEV usage on a given power circuit.
The NetLogo model was designed to
assist the analysis of future PEVs on the NOVEC service community. The model assumed a PHEV-40 Economy battery
would be the standard battery for PEV’s.
The model also assumed that the house’s charge profile would be
constant, that the grid could take electricity back from the PEV’s if needed,
and that the PEV’s would be parked and connected to the grid 80% of the time.
As with any analysis, the results are
based on the data provided at the time of the analysis along with access to
public records and legislative rulings on the matter. It is the Clean Teams’ recommendation that
NOVEC implement some guidelines of their own to their customers on when and how
they may charge their PEVs. Since there
is no global standard on the rate of charge for PEVs, a suggestion to NOVEC is
to allow rate incentives to PEV owner to charge at a slow level 1 rate during
off-peak hours.
1. Background and Research
Despite continued development of
public transportation systems and attempts at improving public accessibility,
America continues to exist as a country reliant on transportation via personal
vehicles. This reliance on independent
transportation is particularly true for those living in suburban and rural
parts of the country, where other modes of transportation may not exist or may
not be convenient.
One of the most significant
considerations of this wide use of personal vehicles is the reliance on
petroleum based automotive fuels. In
recent years, price increases and overall market volatility for petroleum based
fuels has prompted much research and development in the area of alternative
fuels and alternative methods for powering automobiles. While an increased use of hybrid electric
vehicles has taken a small step away from reliance on petroleum based fuels by
increasing efficiency and reducing the fuel used per mile traveled, ultimately
these vehicles still rely on burning gasoline in order to function. As a next logical step, auto makers have
focused on building vehicles able to be powered exclusively by stored electric
power, sourced from the existing power grid.
Without question, replacing gasoline
and other petroleum fuels with electric power will result in an increase demand
for electric as seen by electricity producers and utility companies. The questions that still remain however, are
how much of an increase in electric consumption can be expected, and in what
time period will this impact be experienced.
Ultimately the objective of this project is to quantify the impact which
can be expected and propose methods for best handling the impact.
Specifically from the perspective of a
utility provider, the impact of electric vehicles is of greatest concern when
changes must be made in upgrading infrastructure, or when changes in usage
times necessitate changes to rate structures.
In many locations the existing electrical distribution infrastructure
has been in place for many decades, and was originally designed and constructed
to provide power to customers with much different demands. Because of the limitations of the current
system, there is a genuine concern regarding what increase in load PEVs may
result in, and over what period of time the full impact will be
experienced. Although the widespread use
of electric vehicles will most certainly not occur instantaneously, quantifying
the eventual impact, and estimating a timeline for PEV use can be used to best
prepare and plan for eventual system upgrades.
2. Problem Statement
Given
the normal historical use of electric utilities by residential customers, along
with the likely increase in demand due to more widespread use of Plug-in
Electric Vehicles (PEVs), determine whether current electrical distribution
infrastructure and rate structure are adequate, and if not, determine what
improvements and changes should be made.
Suggested
improvements can be made by choice of physical improvements to infrastructure
to increase electrical load handling capacity, through modification of utility
rate structure, through implementation of PEV charging restrictions, or through
some combination thereof.
3. Architecture
Included
below are Architectural diagrams provided to better understand the relationship
between the utility provider (NOVEC) and residential power customers.
3.1 Overall View
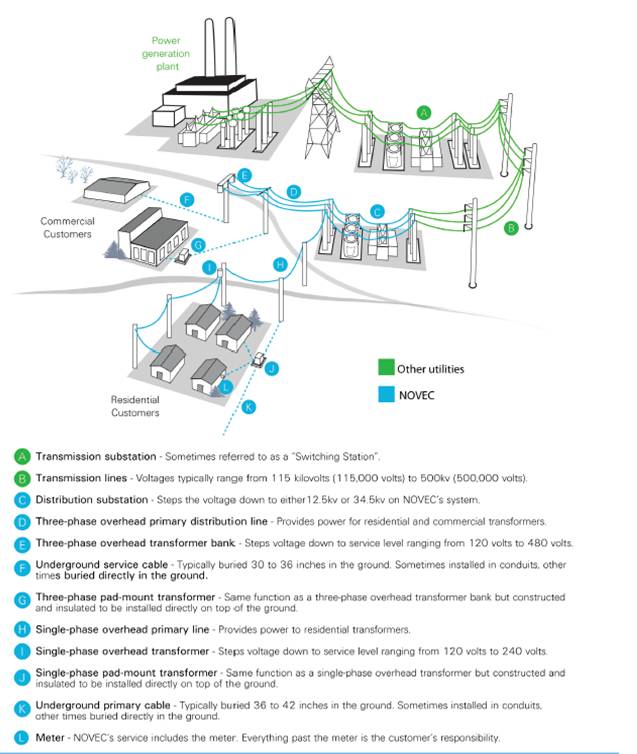
Figure 1:
Overall View (NOVEC 2011)
3.2 Use Cases
Figure 2: Transactions with Residential Customers
3.3 Sequence Diagram
Figure 3: Electricity Sales Sequence
3.4 Class Diagrams
Figure 4:
Small Set of Classes
Figure 5:
Class Diagram
Figure 6:
Class Diagram of CPN model
4. Electric Usage Data Analysis
4.1 Assumptions
In
order to base the analysis on a representative sample population, a set of zip
codes geographically located in Fairfax and Prince William Counties in Virginia
were selected and current residential electric usage data was gathered. Additional demographic information on the
sample area was gathered to better understand the residential customer base
under review. The counties of interest
are located in the suburbs east of Washington, DC, and consequently are the home
of many commuters who work in a large metropolitan area and have affluence
slightly above the national average. It
is expected that due to the above average income, residents in these counties
would be among the first in the country to adopt use of plug in electric
vehicles, and be willing and able to finance the premium cost associated with
new technology and new automobile models.
Due to the large sample size of customers and large volume of data
points gathered for each customer, it was assumed that data gained from the
Sponsor would be an accurate representation for residential electricity usage
across the entire Northern Virginia region.
It
was assumed that the most detrimental impact due to electricity usage by PEVs
would be a result of PEV usage during an already high load period. Data gathered for modeling a daily load curve
covered only one month’s usage, and so July was selected as the month for
analysis, since it is historically known to be a month of particularly high
usage relative to the rest of the year.
While
the average impact of PEVs on electricity usage is of general interest, NOVEC’s
particular concern involves the potential need for distribution system upgrades
or changes to rate structures. NOVEC’s
service area includes several dozen substation points where power is accepted
in from the transmission grid, at which point it is stepped down for
distribution to customers. Flowing out
from these substations are ‘circuit’ branches which serve as the means for
physically getting power to customers.
Any increase in consumer power usage experienced by NOVEC is primarily
limited by the physical thermal capacity of the substation. Since the power flowing through each
substation is simply an aggregation of its respective circuits, NOVEC’s
greatest interest is in identifying circuits which could experience the
greatest load increase, or change in load curve.
4.2 Data Collected
Usage
data gathered for this project was provided by Northern Virginia Electric
Cooperative (NOVEC). Data from NOVEC
customer could be gathered from two types of data sets, high resolution (15
minute interval), and low resolution (monthly interval).
On
a limited number of residential customers, meters are used that collect usage
data with higher resolution than normal, specifically, providing a reading
every 15 minutes for a total of 96 electric demand readings per customer per
day. From these higher resolution
customers, a month’s worth of data was analyzed to model the average daily
usage curve and determine the periods of high load, as well as determine the
actual quantity of electric used per household on a daily basis. High resolution customer data was gathered
from nine different zip codes, specifically, 20109, 20110, 20111, 20120, 20124,
20155, 20169, 22030, 22039 and from a total of 98
customers. This data was taken from July
1, 2011 to July 31, 2011.
Additionally,
NOVEC is able to provide data from all users on a monthly basis. This lower resolution data was requested for
all other residential customers in the zip codes of interest, and used to model
load curves on a seasonal and yearly level.
One year’s worth of monthly data, from September 2010 to August 2011,
was gathered from the nine specified zip codes, from a total of 48,997
customers.
In
addition to the individual user data gathered from NOVEC, aggregated usage data
for the circuits used by the high resolution sample customers was obtained to
determine the potential impact to the overall system.
4.3 Data Used and Conclusion
Both
the high and low resolution data collected from residential users was used to
create daily and annual load curves, respectively. Ultimately, the usage data collected was used
for determining a residential user baseline that subsequently could be impacted
by estimated PEV electric loads.
As
discussed previously, the most direct limitation faced in NOVEC’s distribution
to customers exists at the substation level, where multiple circuit branches
are aggregated. Keeping this in mind,
and in an attempt to be of the greatest use to NOVEC, the high resolution user
data collected and analyzed for sample customers was aggregated along circuit
divisions. The aggregated impact of PEV
use was then analyzed with respect to known load curves at the circuit
level.
From
the data gathered and follow up modeling, the load curves for residential
customers were created and used to determine times which could be best used for
charging of plug in electric vehicles, and which times charging may have the
most detrimental impact from the utility provider’s perspective.
4.4 Statistical Analysis
The
data that NOVEC provided was put through a statistical analysis tool to assist
in determining how well the sample data was representative of the whole. The data was broken down to show 15 minutes,
1 hour and monthly kW-hr usage. A 95%
confidence interval was used in determining what the actual data representation
would be from our sample data. The
following three figures show the results:
Figure 7: Summary of Overall 15 min data
Figure 7, illustrates the 15 minute data with a mean value of 2.63 kW-hr and a standard deviation of 0.86. The P-value in this case is less than 0.005. This data was taken based on one months’ time with 96 data points corresponding to 15 minute interval over one day. This data provided the bases for our model analysis that was conducted later on. With such a small standard deviation and P-value, it was observed that the 15 min data would be of significant importance in our analysis.
Figure 8: Summary of Overall hourly data
Figure 8, illustrates the hourly data with a mean value of 14.37 kW-hr and a standard deviation of 4.78. The P-value in this case is less than 0.024. This data was taken based on one months’ time with 24 data points corresponding to the hours in a day. The mean value here is the kW-hr usage for the specific month the data was collected on. Here again, the standard deviation and P-value were small and with a much smaller data set to work with, it was actually the hourly data that was used to create our CPN model. With over 97% of our data falling into the 95% confidence interval, our model would be a great representation of the current usage and would provide a standard to model how PEVs would or would not impact NOVECs’ customer service.
Figure 9: Summary on Yearly data
Figure 9, illustrates the yearly data with a mean value of 1522 kW-hr and a standard deviation of 539.7. The P-value in this case is less than 0.005. This data was taken based on one years’ time with 94 data points corresponding to the sample circuits from our data. The mean value in this analysis is the monthly kW-hr usage during the year the data was collected for any user. In the yearly data versus the monthly data, the bell curve is steeper due to the usage month to month. The hourly data only looked at one month and the customers were very consistent no when they used or did not use electricity. Over one years’ time, the usage varied from month to month, thus causing some months to be twice as high as the mean value. This was another reason to use the hourly data over one month in our model development, since the model could be run for any given month in the future.
5. Plug-in Electric Vehicle and Charging Data
5.1 PEV Usage
Unfortunately,
very little historical data exists regarding the number of electric vehicles
used across the country, or specifically, in the state of Virginia. Until recently, use of PEVs was limited
almost entirely due to a lack of availability.
Since no major automobile manufacturer produced such vehicles, only very
niche markets existed for consumers to purchase PEVs or substantially retrofit
existing vehicles into plug-in configurations.
More recently however, both Chevrolet and Nissan have started to offer
plug-in electric vehicles for sale to the public in the Volt and Leaf,
respectively. These two manufacturers will soon be joined by Toyota as well,
with the new Prius, plug-in model. For
the purposes of this analysis project, the expected increase in use of PEVs is
assumed to follow the same increase in usage patterns experienced by Hybrid
Electric vehicles. While historical data
on Hybrid vehicle use is also limited, a limited view of their use does exist
in the form of ‘alternative fuel use’ vehicle registrations. Data on the number of these special vehicle
registrations was obtained from the Virginia Department of Motor Vehicles (Gruber).
|
|
Historical Data Provided by Virginia Department of
Motor Vehicles |
|||||||||
|
Date of Data
Collection |
Feb 2005 |
Mar 2005 |
May 2005 |
Jan 2006 |
Apr 2006 |
Jun 2006 |
Feb 2008 |
Jan 2010 |
Sep 2010 |
June 2011 |
|
Total Number of
Active CF Plate Registrations Statewide that are Hybrids |
8,161 |
8,622 |
8,998 |
11,417 |
12,381 |
15,205 |
18,232 |
22,340 |
23,972 |
26,627 |
|
Total Number of
Active CF Plate Registrations in Select Northern Virginia Jurisdictions |
7,136 |
7,521 |
7,826 |
9,707 |
10,501 |
12,867 |
15,396 |
18,849 |
20,317 |
22,638 |
|
Total Number of
Active CF Plate Registrations in Select Northern Virginia Jurisdictions that
are Hybrids |
6,949 |
7,330 |
7,632 |
9,515 |
10,309 |
12,671 |
15,194 |
18,695 |
20,167 |
22,469 |
|
Increase/(Decrease)
from Previous Count |
n/a |
381 |
302 |
1,883 |
794 |
2,362 |
2,523 |
3,501 |
1,472 |
2,302 |
|
Percentage of Total
Active Hybrid CF Plate Registrations Statewide that are in Select Northern
Virginia Jurisdictions |
85.1% |
85% |
84.8% |
83.3% |
83.3% |
83.3% |
83.3% |
83.7% |
84.1% |
84.4% |
Figure 10: DMV Historical Data
NOTE: Select NOVA
jurisdictions include: Cities of Alexandria, Fairfax, Falls Church, Manassas,
Manassas Park; Counties of Arlington, Fairfax, Loudoun, Prince William and
Stafford (these jurisdictions were selected because they are subject to the
emissions inspection program pursuant to Va. Code § 46.2-1178). All data are
based on vehicle's garaged jurisdiction as registered with DMV.
Unfortunately
the data included above only accounts for those vehicles which were registered
as ‘alternative fueled vehicles’, not all hybrid vehicles actually being
used. Despite the limited insight which
can be taken from the data, it should be noted in the period from February 2005
to June 2011 the total number of Hybrid vehicles registered in the State of
Virginia increased nearly 225%. While
this increase may be partially due to owners updating their registration from a
standard registration to the alternative fuels registration, there clearly is a
trend for more widespread use.
Specifically,
it is known that as of September 30, 2011 there were 72,132 hybrid gas and
electric combination vehicles, and 780 electric vehicles registered in the
state of Virginia. This can be compared
to a total of 6,391,396
passenger vehicles registered in Virginia, including 1,676,972 vehicles
registered in Northern Virginia (Gruber). While as of June 2011, Hybrid
vehicles accounted for just over 1.1% of the total number of registered
vehicles in Virginia, if use of PEVs continues to expand at a rate similar to
Hybrids, use of PEVs could ultimately make a significant change in the level of
electricity load devoted to PEVs.
Particularly
of interest in this analysis, is the percentage of Hybrid plates registered in
the Northern Virginia jurisdictions. As
pointed out in the background research information, it is assumed that the
Northern Virginia area would be most likely to see the first impacts of new PEV
use. While the Jurisdictions listed
contain a significant percent of the total state population and a significant
percent of the total state vehicle registrations, (approximately 26% as of June
2011), they represent a disproportionately large percent of the Hybrid vehicle
registrations. Certainly, representing
between 83-85% of the Hybrid registrations, while making up only 26% of the
total vehicle registrations indicates that Northern Virginia would be the most
likely area for adopting PEV use.
As
will be discussed in further detail in the “Scenarios” section, much of what
will determine the sale and widespread use of PEVs is the cost to purchase and
operate, relative to traditional gasoline and diesel powered vehicles. It is expected that developments in battery
technology and improvements in storage capacity at a lower price will improve
the costs associated with purchase and operation of PEVs. While it is beyond the scope of this project
to forecast the market price for gasoline and diesel fuels, it should be noted
that any significant price increase in these petroleum based fuels will almost
certainly make PEVs more attractive from a purely economic perspective, and
will lead to greater use. As of the year
2010, it can already be witnessed that not only have the number of hybrid
vehicles registered increased, but the year over year percentage increase is
much greater than the year over year change in total vehicles registered. As can be seen in the data below provided by
the Virginia Department of Motor Vehicles (Gruber), between 2007 and 2010, the
total numbers of vehicle registrations in both Northern Virginia jurisdictions,
and in the state as a whole, were practically unchanged. By comparison, as discussed previously,
between 2005 and 2011, hybrid registrations in the state experienced a change
of 225%.
|
Virginia
Department of Motor Vehicles |
||
|
Number of
Passenger Vehicles Registered in Virginia |
||
|
Year |
# Vehicles
Registered in NOVA |
# Vehicles
Registered in VA |
|
2007 |
1,606,792 |
6,320,157 |
|
2008 |
1,605,811 |
6,324,372 |
|
2009 |
1,609,707 |
6,306,932 |
|
2010 |
1,643,796 |
6,337,353 |
Figure 11: DMV Registered Vehicles in Virginia
Figure 12: Vehicles Registered over Time
This
comparison of registration records indicates that not only are the number of
hybrid vehicles, and presumably PEVs, increasing, but also, that they are
becoming a greater percent of the total registered vehicles.
6. Usage Scenarios
6.1 Current Worst Case
As
previously discussed, the most significant impact due to the addition of PEV
use is expected to be experienced during periods already considered ‘peak use’
times. Power demand during these peak
use times also can be exacerbated when paired with annual peak times. For example, as determined by the daily and
annual load curves for the aggregated data, peak daily use occurs between the
hours of 1:30 and 5:30 pm, and is high during the month of January during the
winter season, and has an annual high use period in August.
While
the current peak use times are expected to be those of most interest in the
short-term and expected to see minimal impact directly related the use of PEVs,
future scenarios may be altered much more significantly as a result of market
forces and technology.
6.2 Future Worst Case
While
a nominal expected future scenario may provide an idea of what PEVs impact may
be, by creating a worst case scenario, the utility company can get a better
idea of what really is within the realm of possibility regarding electric cars.
First,
the assumption must be made that due to increase in the market price of
petroleum based fuels, PEVs will be used to replace a much larger market share
of automobile drivers. Additionally, it
should be assumed that production costs for PEVs have allowed the price to
become more accessible to a greater number of drivers. Given these assumptions, it can be assumed
that in the future a significant percentage of all automobiles will be PEVs.
In
addition, it should be assumed that due to overall population increase a
greater overall number of drivers will be operating some type of automobile,
many of which will likely be a PEV.
Along
with increases in the number of PEVs being operated due to an increase in
population, a worst case future scenario should assume an overall increase in
use of electricity due to non-automobile related uses due to a greater number
of homes and larger number of actual consumers.
7. Models
7.1 CPN Tools
CPN
Tools was used to model the functional relationship between a NOVEC circuit and
residential power usage associated with that circuit. The model allowed for the
introduction of PHEV usage into the circuit along with historical data provided
for residential usage by customer identification (ID) number. The historical
data was provided by NOVEC for customers with special metering capability
allowing for readings every 15 minutes. The model allowed for setting of
various parameters to simulate increasing PHEV usage. Assumptions were made as
to the types of charging apparatuses that were likely to be employed in the
future. For Level 1 charging the assumption was that chargers at this level
would require 1.2 kW/hr. For Level 2 charging, we assumed 3 distinct levels of
charging capability: 3.3 kW/hr, 6.6 kW/hr, and 16.8 kW/hr (Tesla Motors has
this level of charging capacity with a dedicated line installed). The model
employed a multiplier for each of the four charger types to allow for adjusting
the number of chargers running in the simulation. The model assumed that all
chargers ran for the duration of the simulation. The simulation time was set
for 24 hours or one day’s worth of data. The model was set up so that the
duration of the simulation could be adjusted, depending upon the time interval
being analyzed. We chose 24 hours for the purposes of the model shown in this
report so that one could easily look at the impact of PHEV charging at any
given time period.
For
the purposes of this report, we chose to look at one circuit for a period of 24
hours. The data was from the July 1, 2010 readings. Because the residential
usage data from NOVEC was provided in 15 minute intervals, the data was
recompiled into hourly intervals (summing 4 consecutive 15 minute readings to
obtain an hour’s usage in kW). The circuit we chose was Feeder ID 24-4. This
circuit had 7 customers with the 15 minute metering capability attached to it.
The assumption was that these customers represented a subset that could be used
to extrapolate the impact of PHEVs on the total number of customers on the same
circuit. The customer IDs were:
333203011
333251016
333253032
353053056
353092041
353094066
353103057
The
kW usage data for each customer was then summed up by hour to get the hourly
usage for the circuit. The hourly usage data was then fed into the CPN model.
The
parameters for the CPN model were set such that the model had a 24 hours’ worth
of time to correspond with the 24 hours’ worth of data from the NOVEC
historical usage data. The CPN model introduced 4 different types of PHEV
charging capabilities to cover likely charging capabilities in the future. The
four types of charging capability were broken out as follows:
Level
1: 1.2 kW/hr
Level 2-L (low): 3.3 kW/hr
Level 2-M (medium): 6.6 kW/hr
Level 2-H (high): 16.8 kW/hr
Each
charger type had the ability to set the number of its instances. For example,
for the model we set the Level 1 charger number = 3. This meant that there were
virtually 3 Level 1 chargers plugged into circuit 24-4, meaning that these 3
chargers drew (3 * 1.2kW = 3.6kW) 3.6kW per hour of charge time. Similarly, we
set the number of Level 2-L chargers to 2 for a draw of (2 * 3.3kW = 6.6kW)
6.6kW/hr. For the Level 2-M and Level 2-H chargers, we assumed one each for a
draw of 6.6kW/hr and 16.8kW/hr respectively.
The
next variables we set in the model were to control the number of hours each
charger was drawing from the circuit. This is not to be confused with the
actual time a battery would require to be charged. What we were looking for
here was to represent the draw on the circuit at any time of the day covered by
the historical data fed into the model. Since we were looking at one days’
worth of data, we wished to see the impact of a charger or chargers on the
circuit at any point in time for that 24 hour period. The variables set were
for the start time = 0 and the finish time = 24 to match up with the historical
circuit 24-4 data.
The
CPN model also employed a module to represent the historical usage data. The
data was fed into the simulation in pairs consisting of the time of day (hour)
and the total circuit usage for that hour in kW. Also, each PHEV Charger had a
charger ID so that its individual usage characteristics could be tracked (this
applied to the class of PHEV only and not to the individual virtual instances.
For example, if we set the number of Level1 chargers at 3 and gave them an ID =
“A”, then the “A” would refer to all Level 1 chargers).
The
modules representing the PHEV Chargers and all other sources of power usage
(historical usage data) were daisy-chained such that each pass through the
model represented 1 hour of usage by all of the power consumers (PHEV and
non-PHEV). When the model completed running, various output formats were
created to show different breakouts of the consumed power. Each PHEV Charger
had a meter sink to show the total amount of power in kW consumed and the
period of time of the consumption. At the top level of the model, there was a sink
to capture the total time and kW per PHEV Charger broken out by charger ID and
hour. Finally, a sink was added to the circuit module to show the total kW
usage per hour for each PHEV charger combined with the “normal usage” conveyed
from the historical data.
An
arbitrary global threshold parameter was included in the model to simulate a
brown-out or black-out situation caused by too much draw on the power circuit
under analysis. According to the customer, this value cannot be exactly
determined due to the fact that each circuit is unique in terms of its number
and types of residential customers and its usage characteristics. For the
purposes of this model, the threshold was set high (200kW/hr) so that the model
would run uninterrupted. The reasoning behind this was to let the data speak
for itself. The output generated could be added to the usage curves to show the
impact of PHEV charging on the circuit and from that point, a determination
could be made as to how to handle the extra load, if necessary.
The
output from the model was fed into an Excel spreadsheet and graphs were created
to show the original draw on the circuit from all sources and the draw on the
circuit from all sources plus the PHEVs. As previously stated, there were 7
residential customer IDs on this particular circuit and the assumption was made
that each of them was using a PHEV. Of course there are more than 7 residencies
on this circuit, but the ones included in the data represented those customers
that had the 15 minute interval meters installed. The graphs are displayed
below.
Figure 13: CPN output based on 7/1/10 data
Figure 14: CPN output of % kW increase based on
7/1/10 data
7.2 NetLogo
The
purpose of the simulation model was to confirm our thoughts on the effect of
PEV’s on the power grid, as well as examining the effects of future growth of
consumer adoption of PEV’s on the power grid.
We chose NetLogo for the simulation as it is a product we had used in
the past and it allowed for simple definitions of simulation objects and easy
changes in the simulation objects populations for modeling their
interactions. We decided to model four
outputs with data for each hour of a day.
The first was the amount of electricity all of the houses in the
simulation were using from the grid for each hour. The second was the total amount of
electricity PEV’s were using from the grid for each hour. The third was the amount of electricity the
power grid could use from plugged in PEV’s for each hour. The final output was the total amount of
electricity being used from the power grid for each hour of the day, which was
the sum of the electricity used by houses and PEV’s populating the model. The simulation consisted of two
populations: Houses and PEV’s. Houses
all had the same electricity usage curve.
PEV’s in the simulation have the ability to use electricity from the
power grid, contribute electricity to the grid, and disconnect from the grid to
drive.
The
PEV’s populating the model all have batteries of type PHEV-40 with a battery size
of 20 KW hours, 12 usable kW-hrs approximate charge time of 10.9 hours. The PEV’s in the simulation were only allowed
to drive if they had a 15% battery charge.
This was done as it was assumed that the hypothetical PEV owner would
have to take into account if they could get to their destination and back on
their current charge, since they could not currently assume there would be
charging capabilities outside of their home.
For example a PEV owner would wait to make a trip to the grocery store
until the PEV had enough charge to complete the round trip. This assumption has further implications
depending on the method of charging deployed by a power company. The PEV was assumed to be parked and
available for charging 80% of time. This
was completed in the simulation by only allowing PEV’s with the needed charge
for driving a 20% chance of being driven.
The PEV’s in the simulation were also allowed to contribute electricity
to the power grid if they had attained a certain level of charge. If a PEV had the desired level of charge of a
full battery and they are not driving they contributed electricity back onto
the grid. The amount of electricity
contributed to the power grid by all PEV’s was modeled for each hour of the
day. The PEV’s in the simulation stopped
charging if their battery was fully charged, the battery could be depleted
through driving or contribution of electricity to the power grid.
For
simplicity, houses in the model were defined to have an electrical use profile
modeled on the electrical usage data provided by NOVEC. Their charge for each house in the model was
constant between homes and made to resemble the electrical use profile of July
1st. This was done to
simplify the comparison of the variability in the effects of PEV’s on the power
grid to the normal power grid usage by households. In the simulation the power grid had no
limitations and was assumed to have the capacity to meet any demand for
electricity levied upon it.
Various scenarios were used to examine the effects of PEV’s on the grid consisting of different charging methods and PEV populations. Two charging methods were used for the simulations, unrestricted and restricted charging. For unrestricted charging, if a PEV was connected to the grid and it was neither fully charged nor contributing electricity to the grid, it was using electricity from the grid. For restricted charging, PEV’s normally would charge at certain times of the day, in this case low usage times from 8 pm to 7 am during this time period PEV’s would charge as they would with the unrestricted charge scenario. With the restricted charging scenario however if the PEV’s charge level was below a certain level the PEV would charge to that level at any time of day, even during peak usage times. Other simulation scenarios were based on the population of PEV’s and houses. Restricted and Unrestricted Charging scenarios were simulated with the PEV populations of 50, 100, 200, 300, 400 and 500, while the population of houses stayed at 250. The simulations were 102 times for durations of one 24 hour period and for one year in length. The graphical output for restricted and unrestricted charging for 200 PEV’s is included below. The nominal case we examined was 50 PEV’s in a neighborhood of 250 houses. This scenario seemed likely within the next few years. The worst case scenario was a population of 500 PEV’s in a neighborhood of 250 houses, which would be very unlikely.
Figure 15: Unrestricted charging of 200 PEV’s vs.
250 Houses.
Figure 16: Restricted charging of 200 PEV’s vs. 250
Houses.
Once
the simulation for each scenario was complete and the data for the four outputs
for each hour a day was collected, it was examined using the Minitab software
product. 95% confidence intervals for
the total PEV electricity from the power grid, and the total PEV electrical
contribution to the power grid were created for each hour of a day. Tables with 95% confidence intervals for PEV
electrical use and contribution to the power grid for simulations running one
day and for one year are included in report submission.
As
you can see from the graphs and in the included excel spreadsheet while the
PEV’s can have a significant impact on the power grid, the houses in the
simulation still use the majority of the electricity from the grid. In the worst case scenario with 500 PEV’s and
unrestricted charging, the PEV charge levels never rise above 52% of the total
house charge level for an hour with an average of charge level of 43.3% of that
of houses in a 24 hour period. In the
nominal case with 50 PEV’s with unrestricted charging, the PEV charge levels
never rise above 6% of the total house charge level for an hour with an average
charge level of 4.8% of that of houses in a 24 hour period. The code for the
NetLogo simulation is included in the appendix.
8. Regulations and Incentives
As
of yet, there are no regulations for Plug-in Electric Vehicle (PEV) owners
regulating when or how they may charge their vehicles. Federal government has not arrived a point
where regulations and restrictions have needed to be implemented. It is up to the electricity providers in the
area to determine how much electric power they can provide to their communities
and when it would be appropriate for PEVs to charge. Electric providers have not yet started to
restrict PEV owners from charging their vehicles during peak hours.
Critical regulatory issues will have to be resolved to enable
charging stations installation, both in homes and for public use. State Public
Utility Commissions will have to determine if and how to regulate public
charging stations.
8.1 State and Local
Today
both state and local governments in the NOVEC power providing areas do not have
regulations governing PEV charging.
State and local governments are waiting for the federal government to
make laws and standards that the states will enforce. But the longer it takes for such regulations
to come about, the harder it will be for electric companies such as NOVEC to
keep up with the demand that will be placed on the electric grids in the future
with more and more PEVs on the roads. At
this moment, it is up to the electric providers to instate policy to their
customers as to when and how they may be charging their PEVs, until such laws
whether they are federal or state is in place.
As of yet, the NOVEC communities has not seen a great demand from their
PEV owners on electric draw.
In
the 1990s, the Virginia state legislature enacted a bill, SB1269 requiring net
metering for small solar wind, and hydroelectric systems. The law states that electric utilities will
offer net metering to residential systems of 10 kilowatts or less and
non-residential systems of 25 kilowatts or less. To better understand what is going on here,
net metering is an electricity policy for consumers who own small renewable
energy facilities (such as wind, solar power or home fuel cells) or Vehicle to
Grid (V2G) electric vehicles.
"Net", in this context, is used in the sense of meaning
"what remains after deductions".
Now
that some PEVs are being equipped with large capacity batteries on them, when
they are not charging and plugged into the electric grid, these batteries can
act as a source of electric power back to the grid. Even though bill SB1269 does not speak of PEV
batteries as a source of power, in the future there will be some discussions on
how to regulate the power that PEVs provide back to the electric grid.
8.2 Federal
Although
there are not electric regulations for PEVs at this time, congress continues to
introduce legislation for promoting PEVs for the future. The future of such legislations is unclear at
this time. Thus far, governments at all
levels are willing to address current barriers to PEV deployment, however,
expanding or continuing incentives to purchase PEVs and install charging
infrastructure will show to be very difficult.
Cost-effective policies that decrease the time it takes to purchase a
PEV could prove popular, such as breaking down electricity regulatory barriers
that unnecessarily delay home charger installations.
The
United States has Title Code Section 42, Sub-section 17381, “Statement of
policy on modernization of electricity grid” that states that the United States will support the modernization of the
Nation’s electricity transmission and distribution system to maintain a
reliable and secure electricity infrastructure that can meet future demand growth
to include:
·
Deployment and integration of distributed
resources and generation, including renewable resources
·
Development and
incorporation of demand response, demand-side resources, and energy-efficiency
resources
·
Deployment of “smart”
technologies (real-time, automated, interactive technologies that optimize the
physical operation of appliances and consumer devices) for metering,
communications concerning grid operations and status, and distribution
automation
·
Deployment and integration
of advanced electricity storage and peak-shaving technologies, including
plug-in electric and hybrid electric vehicles
·
Development of standards
for communication and interoperability of appliances and equipment connected to
the electric grid, including the infrastructure serving the grid
Under
this policy, the federal government is responsible for ensuring that the
electric power grid will be able to sustain and support PEVs. Government may pass this responsibility to
state or local government to regulate, but until such legislation is enacted,
there is no standard for electric companies and PEV usage.
Currently,
the only standards being developed are those of the energy transfer connectors
between PEVs and the power grid. SAE
International is working on a range of standards depending on the level of
charge being demanded. The level of
charging refers to the electrical charging connections:
·
Level
I: average household outlet, 120 volts
·
Level
II: common household outlet used for clothes dryer, 240 volts
·
Level
III: under development, used for very fast charging, but will require extensive
infrastructure and may lead to electric power grid impacts if not addressed
8.3 Incentives
Thus
far, government action at all levels have influenced PEV sales and the
integration of these new vehicles into the electrical grid. The Obama
Administration has made an effort to stimulate the growth of the PEV market
through public-private matching grants leveraging billions of stimulus
dollars. Tax incentives of up to $4000
per vehicle for using conversion kits to retrofit conventionally powered
vehicles, and tax incentives of between $2,500 and $7,500 per PEV (depending on
battery capacity) have been implemented in some areas. With these incentives, more and more PEVs
could be on the roads and needing to be charged both at home and in public area
throughout the communities.
9. Conclusion
Having
completed a variety of analysis techniques and considering the great number of
factors which could significantly impact the realized use of PEVs in years to
come, a few conclusions can be made.
While
the automotive market is now offering consumers the opportunity to purchase a
variety of PEVs and providing a means for reducing ongoing transportation costs
by replacing petroleum based fuels, the initial investment cost has clearly
inhibited sales as can be seen in the number of Hybrid Vehicle sales and
registrations. Using the historical
information gathered for Hybrid Vehicles as an indicator of future PEV sales,
no immediate concern exists regarding a widespread use of PEV or draw from the
power grid. Even after years of Hybrid
vehicle availability, they constitute approximately 1% of total vehicles, even
in the most saturated markets. Changes
in the price point of PEVs, and changes in the cost to refuel traditional
vehicles could obviously result in more aggressive adoption of PEV technology,
but currently there are no indicators of such a market shift.
Although
the immediate impact due to the availability and use of PEVs does not pose a
concern, further analysis does show that an eventual widespread adoption of
PEVs can cause a significant shift in the magnitude of electricity used, and
the times at which demand will be most increased. As discussed within the section explaining
the CPN Tools model, assuming that some type of PEV use is adopted by nearly
all homes, electric utility load curves could experience changes of more than
120% increase during the hours now considered ‘off-peak’. Likewise, as shown in the NetLogo model, use
of PEVs by nearly all households stands to make a significant impact on the
total amount of electricity used. Even
when adopted by nearly all homes, it should be noted however, that the loads
anticipated due to PEVs still does not eclipse those loads used by other
household uses.
In
total, while the future adoption of PEVs may result in electric usage that is
of significant concerns to utility providers, in the near term, there does not
appear to be any significant need for infrastructure changes or implementation
of other controlling techniques. As
indicated by the NetLogo modeling, if anything, the use of restricted changing
may be the best solution going forward, particularly if there are no major
upsetting changes in the costs to purchase and power traditional and plug-in vehicles.
10. References
NOVEC
Overview; www.novec.com; August 2011
Gruber,
John; Director Financial Analysis & Reconciliation, Virginia Department of
Motor Vehicles, (email communication), October 26, 2011
Gruber, John;
Director Financial Analysis & Reconciliation, Virginia Department of Motor
Vehicles, (email communication), November 9, 2011
http://www.pewclimate.org/federal/executive/vehicle-standards
MIT. (April
8, 2010). Electrification of the Transportation System. Cambridge, MA:
MIT.
http://www.serconline.org/netmetering/stateactivity.html
http://en.wikipedia.org/wiki/Net_metering
http://en.wikipedia.org/wike/Charging_station
http://www.chevrolet.com/volt-electric-car/
http://www.nissanusa.com/leaf-electric-car/index#/leaf-electric-car/index
http://www.toyota.com/prius-plug-in/
11. Appendix
11.1 CPN Tools Model
11.1.1 Top Level
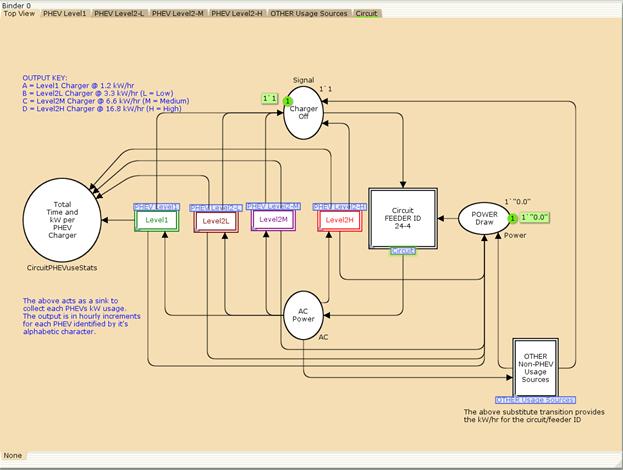
Figure 17: Top Level Diagram
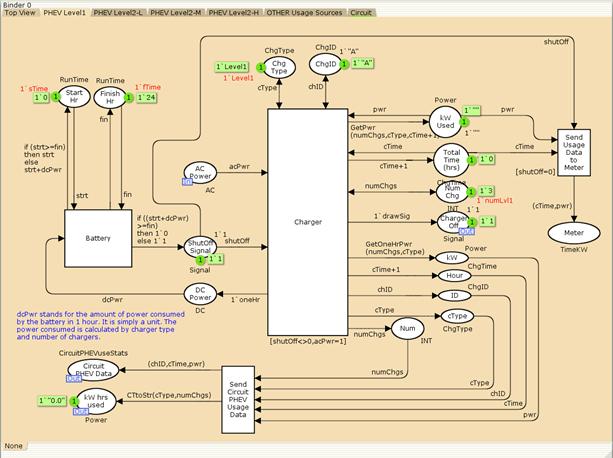
Figure 18: Subpage: PHEV Level1
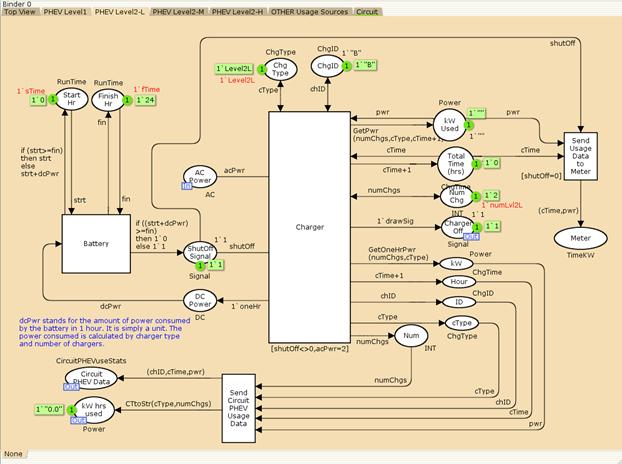
Figure 19: Subpage: PHEV Level2-L
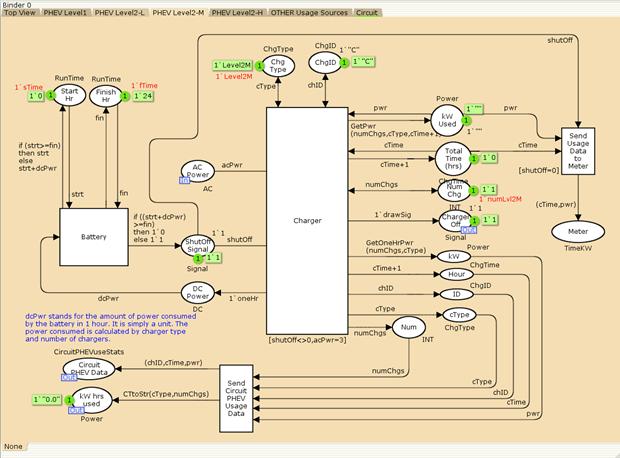
Figure 20: Subpage: PHEV Level2-M
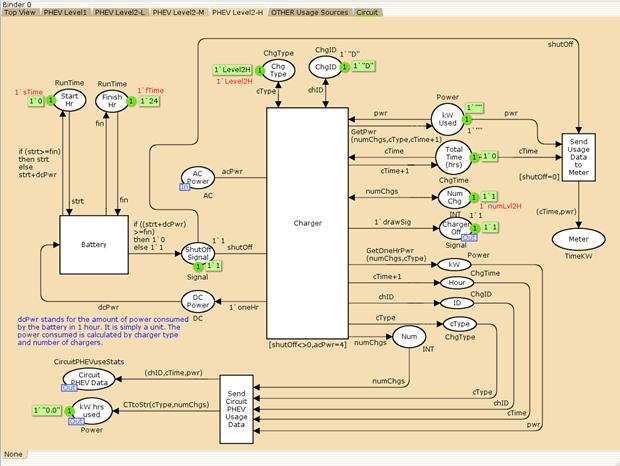
Figure 21: Subpage:
PHEV Level2-H
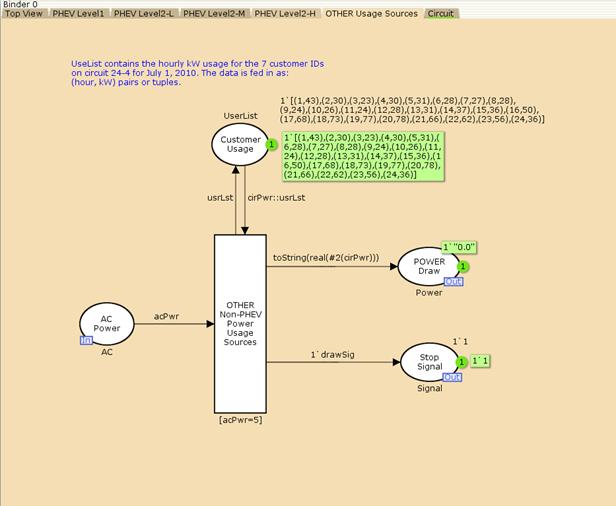
Figure 22: Subpage: OTHER Usage Sources
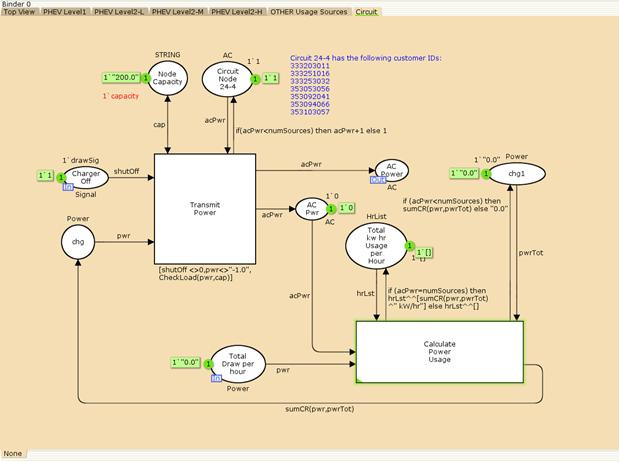
Figure 23: Subpage: Circuit
11.1.2 CPN Tools Code
Colorsets:
colset RunTime = int;
(RunTime: the number of simulation hours)
colset ChgType =
with Level1|Level2L|Level2M|Level2H;
(ChgType: the type of charger distinguished by charge rate)
colset DC = int;
(DC: direct current)
colset AC = int;
(AC: alternating current)
colset Signal = int;
(Signal: charger shutoff signal)
colset ChgTime = int;
(ChgTime: the amount of time the charger was “on”)
colset Power = STRING;
(Power: the amount of power consumed in kW)
colset TimeKW =
product ChgTime*Power;
(TimeKW: the Time and kW info for a charger output to its usage meter)
colset ChgID =
STRING;
(ChgID: the alphabetic character to distinguish the level of charger – used to track output data)
colset CircuitPHEVuseStats
= product ChgID*ChgTime*Power;
(CircuitPHEVuseStats: the total power draw on a circuit from PHEV charging)
colset Charge = int;
(Charge: the amount of hourly charge in the NOVEC use data for all customers in a given hour)
colset CircuitPwr
= product ChgTime*Charge;
(CircuitPwr: the charge time and charge amount used to build the customer list (UserList) from the historical data)
colset UserList =
list CircuitPwr;
(UserList: the list of customers attached to a circuit)
colset HrList =
list STRING;
(HrList: kW usage per hour)
11.1.3 Variables
var strt, fin :
RunTime;
var dcPwr : DC;
var acPwr : AC;
var shutOff :
Signal;
var cType : ChgType;
var cTime : ChgTime;
var pwr,pwrTot
: Power;
var chID : ChgID;
var cap: STRING;
var
numChgs: INT;
var
cirPwr: CircuitPwr;
var usrLst: UserList;
var hrLst: HrList;
11.1.4 Values
The values
set for the scenario shown in this document. They can be changed to run other
scenarios in the CPN Model:
val sTime = 0;
val fTime = 24;
val oneHr = 1;
val
LVL1 = 1.2;
val
LVL2L = 3.3;
val
LVL2M = 6.6;
val
LVL2H = 16.8;
val
numLvl1 = 3;
val
numLvl2L = 2;
val
numLvl2M = 1;
val numLvl2H = 1;
val numSources
= 5;
val drawSig =
1;
val capacity = "200.0";
11.1.5 Functions:
fun toString
rl = Real.toString rl;
fun fromString
stg = Option.valOf(Real.fromString stg);
fun CalcPwr(numChgs,cType,cTime) =
if cType=Level1
then LVL1*real(cTime)*real(numChgs)
else
if cType=Level2L
then LVL2L*real(cTime)*real(numChgs)
else
if cType=Level2M
then LVL2M*real(cTime)*real(numChgs)
else
LVL2H*real(cTime)*real(numChgs);
fun GetPwr(numChgs,cType,cTime) =
1`(toString(CalcPwr(numChgs,cType,cTime))^"
kW");
fun GetOneHrPwr(numChgs,cType) =
if cType=Level1
then 1`(toString(LVL1*real(numChgs))^"
kw") else
if cType=Level2L
then 1`(toString(LVL2L*real(numChgs))^"
kW") else
if cType=Level2M
then 1`(toString(LVL2M*real(numChgs))^"
kW")
else 1`(toString(LVL2H*real(numChgs))^" kW");
fun CTtoStr(cType,numChgs) =
if cType=Level1
then 1`toString(LVL1*real(numChgs)) else
if cType=Level2L
then 1`toString(LVL2L*real(numChgs)) else
if cType=Level2M
then 1`toString(LVL2M*real(numChgs))
else 1`toString(LVL2H*real(numChgs));
fun CheckLoad(pwr,str) =
if(fromString(pwr)<fromString(str))
then true else false;
fun sumCR(pwr,pwrTot) = toString(
fromString(pwr)+fromString(pwrTot));
11.2 NetLogo Model
11.2.1 Code for the restricted model
globals [ grass totalcarEn totalhouseEn totalEn zero driving totalToGrid
HOUR
tse ewe te ttg] ;; keep track of how much grass there is -
added my stuff
;; car and houses are
both breeds of turtle.
breed [car a-car] ;; car is its own plural, so we use
"a-car" as the singular.
breed [houses house]
turtles-own
[energy] ;; both houses and car
have energy
patches-own
[countdown]
to setup
clear-all
ask patches [ set pcolor
green ]
;; check GRASS? switch.
;; if it is true, then grass grows and the
car eat it
;; if it false, then the car don't need to
eat
if grass? [
ask patches [
set countdown random grass-regrowth-time
;; initialize grass grow clocks randomly
set pcolor
one-of [green brown]
]
]
set-default-shape car "car"
create-car initial-number-car ;; create the car, then initialize their
variables
[
set color white
set size 1.5 ;; easier to see
set label-color blue - 2
set energy random 20 ; sets the car randomly 1 - 2x the car gain
from food button
setxy random-xcor random-ycor
]
set-default-shape houses "house"
create-houses initial-number-houses ;; create the houses, then initialize their
variables
[
set color black
set size 1.5 ;; easier to see
set energy random (2 *
house-gain-from-food)
setxy random-xcor random-ycor
]
display-labels
update-plot
end
to go
display-labels
set totalEn 0 ; reseting total energy to zero for next charge round
set totalhouseEn 0;
resetting total house (house) energy to 0
set totalcarEn 0;
resetting total car (car) charge to 0
set driving 1; resetting the driving flag
set totalToGrid 0;
this is the energy being put on the grid by cars car-to-grid
set HOUR ticks mod 24; setting the hour of the day for each hour for
a year
if not any? turtles [ stop ]
ask car [
move
;; modified function to move car
80% of the time and subtract energy if it drives for an hour
eat-grass
;;death
;;reproduce-car
]
ask houses [
;;move ;; my stuff - houses don't move
;;set energy energy
- 1 ;; houses lose energy as they move
catch-car
;; my stuff house is charging
;;death
;;reproduce-houses
]
if grass? [ ask patches [ grow-grass ] ]
tick
set totalEn totalhouseEn + totalcarEn ;;
gathering all of the charge on the grid for the time incremente
update-plot
;export-world
"fire.csv" ;; printing everything to CSV file
; display-labels
; set totalEn 0 ; reseting total energy to zero for next charge round
; set totalhouseEn 0;
resetting total house (house) energy to 0
; set totalcarEn 0;
resetting total car (car) charge to 0
; set driving 1; resetting the driving flag
; set totalToGrid 0;
this is the energy being put on the grid by cars car-to-grid
end
to move ;; turtle procedure
if energy > 3 [ ;; if car doesn't have enought
juice people aint going to drive
if random 10 <= 1 [ ;; car is driving, and will lose energy,
will still pull from the grid for now, probably should add a flag
set energy energy
- 3 ;; the amount of energy the car loses from moving should this be lower than
4?
set driving 5 ;; The car is driving so it can't charge
rt random 50
lt random 50
fd 1
]
]
end
to eat-grass ;; car procedure
;; Here I am keeping track if car move (then
they can't charge) total charge for a day for a car, and
;; the charge they get this hour. The totalcarEn is
the amount of charge all cars have gotten this hour
if pcolor = green [
;;set pcolor
brown my stuff the grid never goes bad
or loses all the energy they need
ifelse (HOUR < 7 or HOUR
> 20 ) [ ; to set restricted charging
;; normal charging
ifelse energy
< 20 [ ;; if the car is charged to
10 i.e. full, it stops charging, 20 is full
if driving < 2 [ ;; if driving is 0 car is home so it can
charge and pull from grid
set energy energy +
car-gain-from-food ;; car gain energy by
eating
set totalcarEn
totalcarEn + car-gain-from-food ;; gathering total charge for tick
]
]
[
set energy 20 ;; if the car is more then full, make it just full.
set totalToGrid totalToGrid + car-gain-from-food; here we are sending
energy to the grid car-to-grid
set energy energy
- car-gain-from-food ;; setting the car to the energy after putting to grid
car-to-grid
]
];; end normal charging
[ ;; start restricted charging
ifelse energy
< 4 [ ;; if the car is charged to
10 i.e. full, it stops charging,ifFoodGain is ~10 the
car nvr charges
if driving < 2 [ ;; if driving is 0 car is home so it can charge
and pull from grid
set energy energy
+ car-gain-from-food ;; car gain energy
by eating
set totalcarEn
totalcarEn + car-gain-from-food ;; gathering total charge for tick
]
]
[
; at this point the car has enough energy
to drive and add to the grid, maybe add a random conditional here
set totalToGrid totalToGrid + car-gain-from-food; here we are sending
energy to the grid car-to-grid
set energy energy
- car-gain-from-food ;; setting the car to the energy after putting to grid
car-to-grid
]
] ;; end restricted charging
if driving > 2 [ ;; apparently the
driving flag is being set by one car and not being reset before the next car
tries to eat so car 1 moves, and sets the flag, but the flag stays set for
car's 2 - 4?
set driving 1 ;; so if I get here a car
is driving, so it won't charge, now the flag is unset for the next car
]
]
end
to reproduce-car ;; car procedure my stuff, got rid of car reproduction
if random-float 100 < car-reproduce [ ;; throw "dice" to see if you will
reproduce
; set
energy (energy / 2) ;;
divide energy between parent and offspring
;
hatch 1 [ rt random-float 360 fd 1 ] ;; hatch an
offspring and move it forward 1 step
]
end
to
reproduce-houses ;; house procedure my stuff, got rid of house reproduction
if random-float 100 < house-reproduce
[ ;; throw "dice" to see if
you will reproduce
;set energy (energy / 2) ;; divide energy between parent
and offspring
;hatch 1 [ rt
random-float 360 fd 1 ] ;; hatch an offspring and move it forward 1
step
]
end
to catch-car ;; house procedure, so 50 Kw a day for a
house, turn that into 3 for food for 30 kw hours at peak
if pcolor = green
[ ;; added my stuff so houses can eat
grass and be different from car
;; the total eng for houses will eaqual the current house value because I am not keeping
track
;; of total house/house usage over a day, I
only care about how much it pulled off the grid now
if
HOUR = 0[ ;; my stuff - this will be the
houses charge profile for hour 1
set energy ( house-gain-from-food * 4
) ;; car gain energy by eating
set totalhouseEn
totalhouseEn + ( house-gain-from-food * 1) ;; gathering total charge for tick
]
if HOUR = 1[ ;; my stuff - this will be the houses charge
profile for hour 1
set energy ( house-gain-from-food * 4
) ;; car gain energy by eating
set totalhouseEn
totalhouseEn + ( house-gain-from-food * 1) ;; gathering total charge for tick
]
if HOUR = 2[ ;; my stuff - this will be the houses charge
profile for hour 1
set energy ( house-gain-from-food * 5
) ;; car gain energy by eating
set totalhouseEn
totalhouseEn + ( house-gain-from-food * 5) ;; gathering total charge for tick
]
if HOUR = 3[ ;; my stuff - this will be the houses charge
profile for hour 1
set energy energy
+ ( house-gain-from-food * 4 ) ;; car
gain energy by eating
set totalhouseEn
totalhouseEn + ( house-gain-from-food * 4 ) ;; gathering total charge for tick
]
if HOUR = 4[ ;; my stuff - this will be the houses charge
profile for hour 1
set energy ( house-gain-from-food * 4
) ;; car gain energy by eating
set totalhouseEn
totalhouseEn + ( house-gain-from-food * 4 ) ;;
gathering total charge for tick
]
if HOUR = 5[ ;; my stuff - this will be the houses charge
profile for hour 1
set energy ( house-gain-from-food * 4
) ;; car gain energy by eating
set totalhouseEn
totalhouseEn + ( house-gain-from-food * 4 ) ;; gathering total charge for tick
]
if HOUR = 6[ ;; my stuff - this will be the houses charge
profile for hour 1
set energy ( house-gain-from-food * 4
) ;; car gain energy by eating
set totalhouseEn
totalhouseEn + ( house-gain-from-food * 4 ) ;; gathering total charge for tick
]
if HOUR = 7[ ;; my stuff - this will be the houses charge
profile for hour 1
set energy ( house-gain-from-food * 4
) ;; car gain energy by eating
set totalhouseEn
totalhouseEn + ( house-gain-from-food * 4 ) ;; gathering total charge for tick
]
if HOUR = 8[ ;; my stuff - this will be the houses charge
profile for hour 1
set energy ( house-gain-from-food * 4
) ;; car gain energy by eating
set totalhouseEn
totalhouseEn + ( house-gain-from-food * 4 ) ;; gathering total charge for tick
]
if HOUR = 9[ ;; my stuff - this will be the houses charge
profile for hour 1
set energy ( house-gain-from-food * 5
) ;; car gain energy by eating
set totalhouseEn
totalhouseEn + ( house-gain-from-food * 5 ) ;; gathering total charge for tick
]
if HOUR = 10[ ;; my stuff - this will be the houses charge
profile for hour 1
set energy ( house-gain-from-food * 4
) ;; car gain energy by eating
set totalhouseEn
totalhouseEn + ( house-gain-from-food * 4 ) ;; gathering total charge for tick
]
if HOUR = 11[ ;; my stuff - this will be the houses charge
profile for hour 1
set energy ( house-gain-from-food * 4
) ;; car gain energy by eating
set totalhouseEn
totalhouseEn + ( house-gain-from-food * 4 ) ;; gathering total charge for tick
]
if HOUR = 12[ ;; my stuff - this will be the houses charge
profile for hour 1
set energy ( house-gain-from-food * 5 )
;; car gain energy by eating
set totalhouseEn
totalhouseEn + ( house-gain-from-food * 5 ) ;; gathering total charge for tick
]
if HOUR = 13[ ;; my stuff - this will be the houses charge
profile for hour 1
set energy ( house-gain-from-food * 6
) ;; car gain energy by eating
set totalhouseEn
totalhouseEn + ( house-gain-from-food * 6 ) ;; gathering total charge for tick
]
if HOUR = 14[ ;; my stuff - this will be the houses charge
profile for hour 1
set energy ( house-gain-from-food * 11
) ;; car gain energy by eating
set totalhouseEn
totalhouseEn + ( house-gain-from-food * 11 ) ;; gathering total charge for tick
]
if HOUR = 15[ ;; my stuff - this will be the houses charge
profile for hour 1
set energy ( house-gain-from-food * 1.75
) ;; car gain energy by eating
set totalhouseEn
totalhouseEn + ( house-gain-from-food * 1.75 ) ;; gathering total charge for tick
]
if HOUR = 16[ ;; my stuff - this will be the houses charge
profile for hour 1
set energy ( house-gain-from-food * 4
) ;; car gain energy by eating
set totalhouseEn
totalhouseEn + ( house-gain-from-food * 4 ) ;; gathering total charge for tick
]
if HOUR = 17[ ;; my
- this will be the houses charge profile for hour 1
set energy ( house-gain-from-food * 4 )
;; car gain energy by eating
set totalhouseEn
totalhouseEn + ( house-gain-from-food * 4 ) ;; gathering total charge for tick
]
if HOUR = 18[ ;; my stuff - this will be the houses charge
profile for hour 1
set energy ( house-gain-from-food * 4
) ;; car gain energy by eating
set totalhouseEn
totalhouseEn + ( house-gain-from-food * 4 ) ;; gathering total charge for tick
]
if HOUR = 19[ ;; my stuff - this will be the houses charge
profile for hour 1
set energy ( house-gain-from-food * 9
) ;; car gain energy by eating
set totalhouseEn
totalhouseEn + ( house-gain-from-food * 9 ) ;; gathering total charge for tick
]
if HOUR = 20[ ;; my stuff - this will be the houses charge
profile for hour 1
set energy ( house-gain-from-food * 6
) ;; car gain energy by eating
set totalhouseEn
totalhouseEn + ( house-gain-from-food * 6 ) ;; gathering total charge for tick
]
if HOUR = 21[ ;; my stuff - this will be the houses charge
profile for hour 1
set energy ( house-gain-from-food * 6
) ;; car gain energy by eating
set totalhouseEn
totalhouseEn + ( house-gain-from-food * 6 ) ;; gathering total charge for tick
]
if HOUR = 22[ ;; my stuff - this will be the houses charge
profile for hour 1
set energy ( house-gain-from-food * 6
) ;; car gain energy by eating
set totalhouseEn
totalhouseEn + ( house-gain-from-food * 6 ) ;; gathering total charge for tick
]
if HOUR = 23[ ;; my stuff - this will be the houses charge
profile for hour 1
set energy ( house-gain-from-food * 5
) ;; car gain energy by eating
set totalhouseEn
totalhouseEn + ( house-gain-from-food * 5 ) ;; gathering total charge for tick
]
if HOUR = 24[ ;; my stuff - this will be the houses charge
profile for hour 1
set energy ( house-gain-from-food * 4
) ;; car gain energy by eating
set totalhouseEn
totalhouseEn + ( house-gain-from-food * 4 ) ;; gathering total charge for tick
]
]
;;let prey one-of car-here ;; grab a random car
;;if prey != nobody ;; did we get
one? if so,
;; [
ask prey [ die ]
;; kill it
;;
set energy energy + house-gain-from-food ] ;;
get energy from eating
end
to death ;; turtle procedure
;; when energy dips below zero, die
if energy < 0 [ die ]
end
to grow-grass ;; patch procedure
;; countdown on brown patches: if reach 0,
grow some grass
if pcolor = brown [
ifelse countdown
<= 0
[ set pcolor
green
set countdown grass-regrowth-time ]
[ set countdown countdown
- 1 ]
]
end
to update-plot
set grass count patches with [pcolor = green]
set-current-plot "populations"
set-current-plot-pen "totalHouseEn" ;
my stuff - plotting all of the house charging for an hour
plot totalhouseEn ; my
stuff - plotting all of the house charging for an hour
set-current-plot-pen "totalCarEn" ;
my stuff - plotting all of the car charging for an hour
plot totalcarEn ; my
stuff - plotting all of the car charging for an hour
set-current-plot-pen "totalEn" ; my
stuff - plotting all of the charging for an hour
plot totalEn ; my
stuff - plotting all of the charging for an hour
set-current-plot-pen "totalToGrid"; car-to-grid
plot totalToGrid ;
car-to-grid
end
to display-labels
ask turtles [ set label "" ]
if show-energy? [
ask houses [ set label round energy ]
ask car [ set label round energy ]
]
end
; Copyright 1997 Uri Wilensky. All rights reserved.
; The full copyright
notice is in the Information tab.
11.2.2 Code for the un-restricted model
globals [ grass totalcarEn totalhouseEn totalEn zero driving totalToGrid
HOUR
tse ewe te ttg] ;; keep track of how much grass there is -
added my stuff
;; car and houses are
both breeds of turtle.
breed [car a-car] ;; car is its own plural, so we use
"a-car" as the singular.
breed [houses house]
turtles-own
[energy] ;; both houses and car
have energy
patches-own
[countdown]
to setup
clear-all
ask patches [ set pcolor
green ]
;; check GRASS? switch.
;; if it is true, then grass grows and the
car eat it
;; if it false, then the car don't need to
eat
if grass? [
ask patches [
set countdown random grass-regrowth-time
;; initialize grass grow clocks randomly
set pcolor
one-of [green brown]
]
]
set-default-shape car "car"
create-car initial-number-car ;; create the car, then initialize their
variables
[
set color white
set size 1.5 ;; easier to see
set label-color blue - 2
set energy random 20 ; sets the car randomly 1 - 2x the car gain
from food button
setxy random-xcor random-ycor
]
set-default-shape houses "house"
create-houses initial-number-houses ;; create the houses, then initialize their
variables
[
set color black
set size 1.5 ;; easier to see
set energy random (2 *
house-gain-from-food)
setxy random-xcor random-ycor
]
display-labels
update-plot
end
to go
display-labels
set totalEn 0 ; reseting total energy to zero for next charge round
set totalhouseEn 0;
resetting total house (house) energy to 0
set totalcarEn 0;
resetting total car (car) charge to 0
set driving 1; resetting the driving flag
set totalToGrid 0;
this is the energy being put on the grid by cars car-to-grid
set HOUR ticks mod 24; setting the hour of the day for each hour for
a year
if not any? turtles [ stop ]
ask car [
move
;; modified function to move car
80% of the time and subtract energy if it drives for an hour
eat-grass
;;death
;;reproduce-car
]
ask houses [
;;move ;; my stuff - houses don't move
;;set energy energy
- 1 ;; houses lose energy as they move
catch-car
;; my stuff house is charging
;;death
;;reproduce-houses
]
if grass? [ ask patches [ grow-grass ] ]
tick
set totalEn totalhouseEn + totalcarEn ;;
gathering all of the charge on the grid for the time incremente
update-plot
;export-world
"fire.csv" ;; printing everything to CSV file
; display-labels
; set totalEn 0 ; reseting total energy to zero for next charge round
; set totalhouseEn 0;
resetting total house (house) energy to 0
; set totalcarEn 0;
resetting total car (car) charge to 0
; set driving 1; resetting the driving flag
; set totalToGrid 0;
this is the energy being put on the grid by cars car-to-grid
end
to move ;; turtle procedure
if energy > 3 [ ;; if car doesn't have enought
juice people aint going to drive
if random 10 <= 1 [ ;; car is driving, and will lose energy,
will still pull from the grid for now, probably should add a flag
set energy energy
- 3 ;; the amount of energy the car loses from moving should this be lower than
4?
set driving 5 ;; The car is driving so it can't charge
rt random 50
lt random 50
fd 1
]
]
end
to eat-grass ;; car procedure
;; Here I am keeping track if car move (then
they can't charge) total charge for a day for a car, and
;; the charge they get this hour. The totalcarEn is
the amount of charge all cars have gotten this hour
if pcolor = green [
;;set pcolor
brown my stuff the grid never goes bad
or loses all the energy they need
;; normal charging
ifelse energy
< 20 [ ;; if the car is charged to
10 i.e. full, it stops charging, 20 is full
if driving < 2 [ ;; if driving is 0 car is home so it can
charge and pull from grid
set energy energy
+ car-gain-from-food ;; car gain energy
by eating
set totalcarEn
totalcarEn + car-gain-from-food ;; gathering total charge for tick
]
]
[
set energy 20 ;; if the car is more then full, make it just full.
set totalToGrid totalToGrid + car-gain-from-food; here we are sending
energy to the grid car-to-grid
set energy energy
- car-gain-from-food ;; setting the car to the energy after putting to grid
car-to-grid
]
if driving > 2 [ ;; apparently the
driving flag is being set by one car and not being reset before the next car
tries to eat so car 1 moves, and sets the flag, but the flag stays set for
car's 2 - 4?
set driving 1 ;; so if I get here a car
is driving, so it won't charge, now the flag is unset for the next car
]
]
end
to reproduce-car ;; car procedure my stuff, got rid of car reproduction
if random-float 100 < car-reproduce [ ;; throw "dice" to see if you will
reproduce
; set
energy (energy / 2) ;;
divide energy between parent and offspring
;
hatch 1 [ rt random-float 360 fd 1 ] ;; hatch an
offspring and move it forward 1 step
]
end
to
reproduce-houses ;; house procedure my stuff, got rid of house reproduction
if random-float 100 < house-reproduce
[ ;; throw "dice" to see if
you will reproduce
;set energy (energy / 2) ;; divide energy between parent
and offspring
;hatch 1 [ rt
random-float 360 fd 1 ] ;; hatch an offspring and move it forward 1
step
]
end
to catch-car ;; house procedure, so 50 Kw a day for a
house, turn that into 3 for food for 30 kw hours at peak
if pcolor = green [ ;;
added my stuff so houses can eat grass and be different from car
;; the total eng for houses will eaqual the current house value because I am not keeping
track
;; of total house/house usage over a day, I
only care about how much it pulled off the grid now
if HOUR = 0[ ;; my stuff - this will be the houses charge
profile for hour 1
set energy ( house-gain-from-food * 4
) ;; car gain energy by eating
set totalhouseEn
totalhouseEn + (house-gain-from-food * 4) ;; gathering total charge for tick
]
if HOUR = 1[ ;; my stuff - this will be the houses charge
profile for hour 1
set energy ( house-gain-from-food * 4
) ;; car gain energy by eating
set totalhouseEn
totalhouseEn + (house-gain-from-food * 4) ;; gathering total charge for tick
]
if HOUR = 2[ ;; my stuff - this will be the houses charge
profile for hour 1
set energy ( house-gain-from-food * 5
) ;; car gain energy by eating
set totalhouseEn
totalhouseEn + (house-gain-from-food * 1.25) ;; gathering total charge for tick
]
if HOUR = 3[ ;; my stuff - this will be the houses charge
profile for hour 1
set energy energy
+ ( house-gain-from-food * 4 ) ;; car
gain energy by eating
set totalhouseEn
totalhouseEn + ( house-gain-from-food * 4 ) ;; gathering total charge for tick
]
if HOUR = 4[ ;; my stuff - this will be the houses charge
profile for hour 1
set energy ( house-gain-from-food * 4
) ;; car gain energy by eating
set totalhouseEn
totalhouseEn + ( house-gain-from-food * 4 ) ;;
gathering total charge for tick
]
if HOUR = 5[ ;; my stuff - this will be the houses charge
profile for hour 1
set energy ( house-gain-from-food * 4
) ;; car gain energy by eating
set totalhouseEn
totalhouseEn + ( house-gain-from-food * 4 ) ;; gathering total charge for tick
]
if HOUR = 6[ ;; my stuff - this will be the houses charge
profile for hour 1
set energy ( house-gain-from-food * 4
) ;; car gain energy by eating
set totalhouseEn
totalhouseEn + ( house-gain-from-food * 4 ) ;; gathering total charge for tick
]
if HOUR = 7[ ;; my stuff - this will be the houses charge
profile for hour 1
set energy ( house-gain-from-food * 4
) ;; car gain energy by eating
set totalhouseEn
totalhouseEn + ( house-gain-from-food * 4 ) ;; gathering total charge for tick
]
if HOUR = 8[ ;; my stuff - this will be the houses charge
profile for hour 1
set energy ( house-gain-from-food * 4
) ;; car gain energy by eating
set totalhouseEn
totalhouseEn + ( house-gain-from-food * 4 ) ;; gathering total charge for tick
]
if HOUR = 9[ ;; my stuff - this will be the houses charge
profile for hour 1
set energy ( house-gain-from-food * 5
) ;; car gain energy by eating
set totalhouseEn
totalhouseEn + (house-gain-from-food * 1.25 ) ;; gathering total charge for tick
]
if HOUR = 10[ ;; my stuff - this will be the houses charge
profile for hour 1
set energy ( house-gain-from-food * 4
) ;; car gain energy by eating
set totalhouseEn
totalhouseEn + ( house-gain-from-food * 4 ) ;; gathering total charge for tick
]
if HOUR = 11[ ;; my stuff - this will be the houses charge
profile for hour 1
set energy ( house-gain-from-food * 4
) ;; car gain energy by eating
set totalhouseEn
totalhouseEn + ( house-gain-from-food * 4 ) ;; gathering total charge for tick
]
if HOUR = 12[ ;; my stuff - this will be the houses charge
profile for hour 1
set energy ( house-gain-from-food * 5 )
;; car gain energy by eating
set totalhouseEn
totalhouseEn + ( house-gain-from-food * 5 ) ;; gathering total charge for tick
]
if HOUR = 13[ ;; my stuff - this will be the houses charge
profile for hour 1
set energy ( house-gain-from-food * 6
) ;; car gain energy by eating
set totalhouseEn
totalhouseEn + ( house-gain-from-food * 6 ) ;; gathering total charge for tick
]
if HOUR = 14[ ;; my stuff - this will be the houses charge
profile for hour 1
set energy ( house-gain-from-food * 11
) ;; car gain energy by eating
set totalhouseEn
totalhouseEn + ( house-gain-from-food * 11 ) ;; gathering total charge for tick
]
if HOUR = 15[ ;; my stuff - this will be the houses charge
profile for hour 1
set energy ( house-gain-from-food * 1.75
) ;; car gain energy by eating
set totalhouseEn
totalhouseEn + (house-gain-from-food * 1.75 ) ;; gathering total charge for tick
]
if HOUR = 16[ ;; my stuff - this will be the houses charge
profile for hour 1
set energy ( house-gain-from-food * 4
) ;; car gain energy by eating
set totalhouseEn
totalhouseEn + ( house-gain-from-food * 4 ) ;; gathering total charge for tick
]
if HOUR = 17[ ;; my
- this will be the houses charge profile for hour 1
set energy ( house-gain-from-food * 4 )
;; car gain energy by eating
set totalhouseEn
totalhouseEn + ( house-gain-from-food * 4 ) ;; gathering total charge for tick
]
if HOUR = 18[ ;; my stuff - this will be the houses charge
profile for hour 1
set energy ( house-gain-from-food * 4
) ;; car gain energy by eating
set totalhouseEn
totalhouseEn + ( house-gain-from-food * 4 ) ;; gathering total charge for tick
]
if HOUR = 19[ ;; my stuff - this will be the houses charge
profile for hour 1
set energy ( house-gain-from-food * 9
) ;; car gain energy by eating
set totalhouseEn
totalhouseEn + ( house-gain-from-food * 9 ) ;; gathering total charge for tick
]
if HOUR = 20[ ;; my stuff - this will be the houses charge
profile for hour 1
set energy ( house-gain-from-food * 6
) ;; car gain energy by eating
set totalhouseEn
totalhouseEn + ( house-gain-from-food * 6 ) ;; gathering total charge for tick
]
if HOUR = 21[ ;; my stuff - this will be the houses charge
profile for hour 1
set energy ( house-gain-from-food * 6
) ;; car gain energy by eating
set totalhouseEn
totalhouseEn + ( house-gain-from-food * 6 ) ;; gathering total charge for tick
]
if HOUR = 22[ ;; my stuff - this will be the houses charge
profile for hour 1
set energy ( house-gain-from-food * 6
) ;; car gain energy by eating
set totalhouseEn
totalhouseEn + ( house-gain-from-food * 6 ) ;; gathering total charge for tick
]
if HOUR = 23[ ;; my stuff - this will be the houses charge
profile for hour 1
set energy ( house-gain-from-food * 5
) ;; car gain energy by eating
set totalhouseEn
totalhouseEn + (house-gain-from-food * 5 ) ;; gathering total charge for tick
]
if HOUR = 24[ ;; my stuff - this will be the houses charge
profile for hour 1
set energy ( house-gain-from-food * 4
) ;; car gain energy by eating
set totalhouseEn
totalhouseEn + ( house-gain-from-food * 4 ) ;; gathering total charge for tick
]
]
;;let prey one-of car-here ;; grab a random car
;;if prey != nobody ;; did we get
one? if so,
;; [
ask prey [ die ]
;; kill it
;;
set energy energy + house-gain-from-food ] ;;
get energy from eating
end
to death ;; turtle procedure
;; when energy dips below zero, die
if energy < 0 [ die ]
end
to grow-grass ;; patch procedure
;; countdown on brown patches: if reach 0,
grow some grass
if pcolor = brown [
ifelse countdown
<= 0
[ set pcolor
green
set countdown grass-regrowth-time ]
[ set countdown countdown
- 1 ]
]
end
to update-plot
set grass count patches with [pcolor = green]
set-current-plot "populations"
set-current-plot-pen "totalHouseEn" ;
my stuff - plotting all of the house charging for an hour
plot totalhouseEn ; my
stuff - plotting all of the house charging for an hour
set-current-plot-pen "totalCarEn" ;
my stuff - plotting all of the car charging for an hour
plot totalcarEn ; my
stuff - plotting all of the car charging for an hour
set-current-plot-pen "totalEn" ; my
stuff - plotting all of the charging for an hour
plot totalEn ; my
stuff - plotting all of the charging for an hour
set-current-plot-pen "totalToGrid"; car-to-grid
plot totalToGrid ;
car-to-grid
end
to display-labels
ask turtles [ set label "" ]
if show-energy? [
ask houses [ set label round energy ]
ask car [ set label round energy ]
]
end
; Copyright 1997 Uri Wilensky. All rights reserved.
; The full copyright notice
is in the Information tab.
11.3 Back-up Charts
Figure 24: NOVEC Yearly Electric Draw
Figure
25: All Users kW consumption
Figure 26:
Daily Circuit Usage
Figure 27:
Overall Daily
Usage
Figure 28: Circuit ID unknown
Figure 29: Circuit ID 2-1
Figure 30: Circuit ID 2-4
Figure 31: Circuit ID 3-1
Figure 32: Circuit ID 4-1
Figure 33: Circuit ID 4-2
Figure 34: Circuit ID 4-3
Figure 35: Circuit ID 4-4
Figure 36: Circuit ID 4-8
Figure 37: Circuit ID 5-1
Figure 38: Circuit ID 19-1
Figure 39: Circuit ID 19-2
Figure 40: Circuit ID 19-3
Figure 41: Circuit ID 19-4
Figure 42: Circuit ID 20-1
Figure 43: Circuit ID 23-1
Figure 44: Circuit ID 23-3
Figure 45: Circuit ID 23-4
Figure 46: Circuit ID 24-1
Figure 47: Circuit ID 24-2
Figure 48: Circuit ID 24-4
Figure 49: Circuit ID 24-8
Figure 50: Circuit ID 25-2
Figure 51: Circuit ID 25-4
Figure 52: Circuit ID 32-3
Figure 53: Circuit ID 32-12
Figure 54: Circuit ID 36-1
Figure 55: Circuit ID 36-2
Figure 56: Circuit ID 38-2
Figure 57: Circuit ID 38-4
Figure 58: Circuit ID 38-8
Figure 59: Circuit ID 44-2
Figure 60: Circuit ID 44-4
Figure 61: Circuit ID 44-5
Figure 62: Circuit ID 44-7
Figure 63: Circuit ID 46-1
Figure 64: Circuit ID 46-2
Figure 65: Circuit ID 46-4
Figure 66: Circuit ID 46-5
Figure 67: Circuit ID 57-1