OR 680: Results
George Mason University
Department of Systems Engineering & Operations Research
Spring 2010
Results
The graphics in this section are used to represent strangle strategy performance using two metrics, TWR and percent return. TWR measures the performance of a strategy over multiple trading periods, while percent return is the percent difference in assets over a single trading period. In this section TWR will be measured in multiple of initial investment so TWR = 5 means the final equity is 5 times the initial equity. Maximum draw down is the greatest percentage drop in capital between any two points in a particular period. Investors may not necessarily invest at the beginning of an analyzed period so maximum draw down helps to assess risk by showing the maximum possible loss.
Early analysis of the available data showed the most available data are from years 2007 to 2009, with 2004 to 2006 usable but not conclusive, and all prior data unusable. Therefore we perform our analysis first with the overall data from 2007 to 2009 and then, with 2004 to 2006 separately.
Days Before Expiration
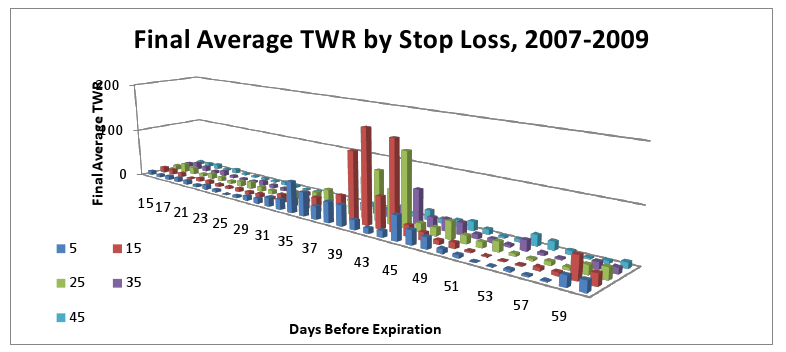
First we searched for the optimal trading day before expiration to write options, and then we found it to be between 39 and 44 days before expiration (note: there is no data for 40 and 41 days before expiration because there is no trading on Saturday and Sunday). This graph shows averages of all optimization model outputs sorted by days before expiration. Each bar in this chart is the average of all strategies (including all variations of parameters and modifications) from 2007 to 2007 with a specific day before expiration.
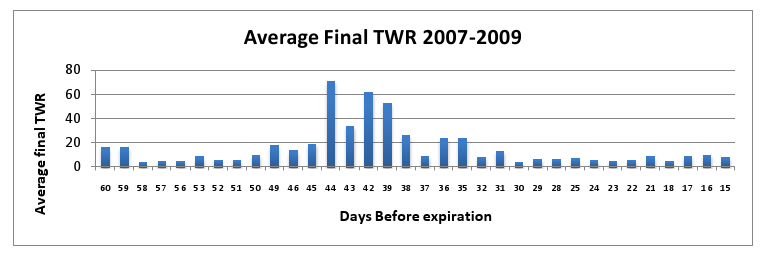
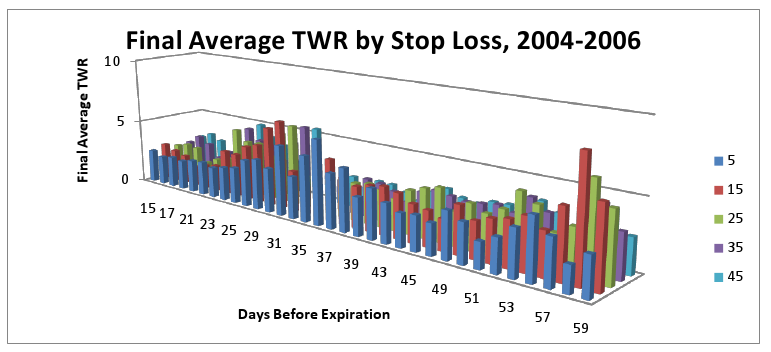
Based on this and many following charts we are confident that (39-44) days before expiration is the best time to sell a strangle strategy for 2007-2009. According to the charts, we begin to narrow down the strategies shown and 39-44 days before expiration are still clearly optimal. Therefore we believe this parameter is not highly dependent on other parameters. We also searched for an optimal selling date for 2004-2006 but there was no obvious optimal date. The following graph is for 2004-2006.
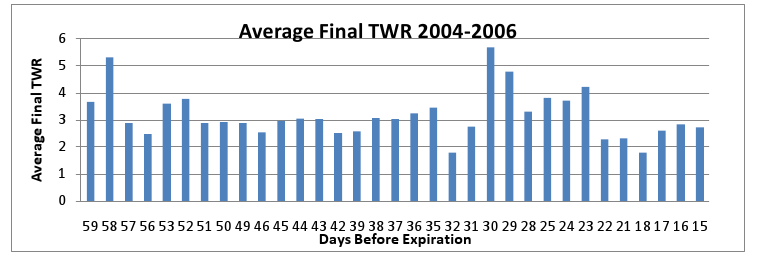
Final TWR is an order of magnitude less than 2007-2008 due to fewer available trades stemming from incomplete data. To overcome the data availability bias we use average percent monthly return to compare the time periods. We compare average monthly returns below:
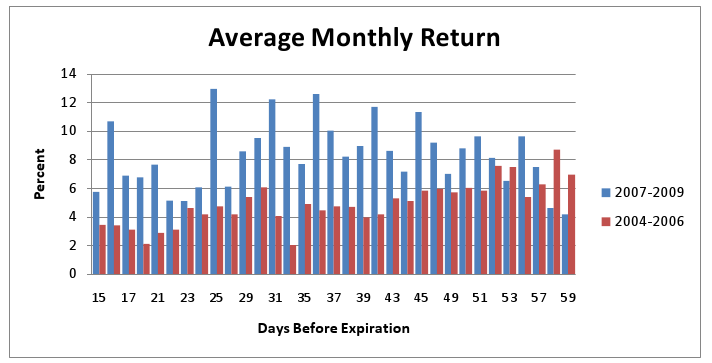
2007-2009 averages dominate 2004-2006 except for three days near 60 days before expiration. In some cases, 2007-2009 averages are at least twice as much as 2004-2006 averages leading us to examine premium prices.
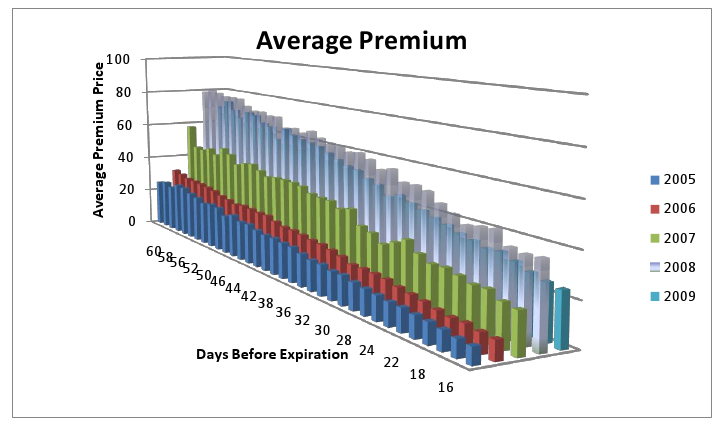
Initial premium received by the options writer is a large factor in final payoffs and 2007-2009 premiums are substantially higher than 2005 and 2006.
Stop-Loss
The next parameter to analyze is stop-loss. The following graph separates model outputs by both days before expiration and stop-loss for the period 2007-2009. Each bar in the following chart is the average of all model outputs with fixed day before expiration and stop-loss. The best stop-losses are either 15 or 20. In the optimal trading day range of 39-44 days, stop-loss value of 15 is superior for 39 and 44 days before expiration, while stop-loss value of 20 is superior for 42 and 43 days before expiration.
The next graph shows a stop-loss comparison for 2004-2007. Note the TWRs for 2004-2006 are much lower than 2007-2009. That is due to missing data in the earlier years. Since the model skips trading for months where data is missing, profitable strategies with fewer trades will result in lesser TWR. Therefore 2007-2009 and 2004-2006 are not comparable as they have different amounts of available data, however stop-loss values in 2004-2006 are comparable to each other.
Strike Prices
We analyzed call and put strike prices individually with the same method used for stop-loss but there are no clear results. Some strike prices are better than other strike prices, so we decided to analyze both strike prices together. We expect that call and put pairs have unique properties that require analysis of both strike prices at once.
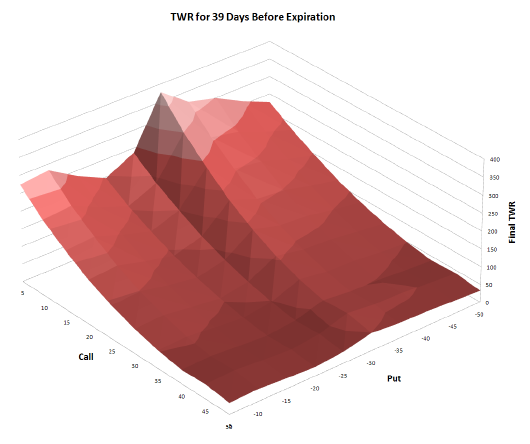
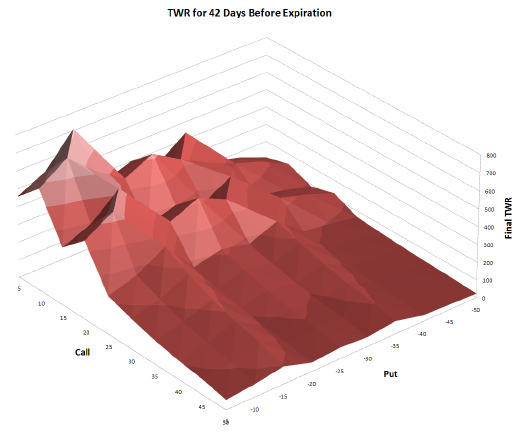
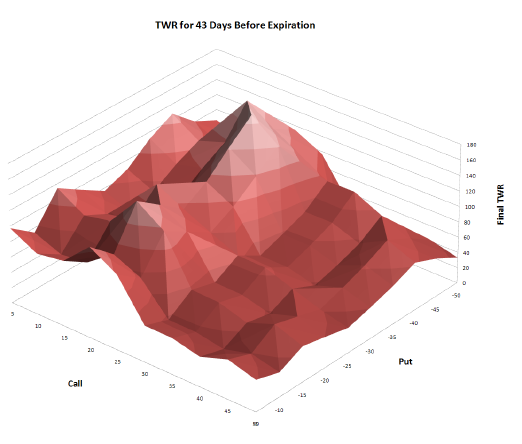
The next four surface graphs vary call and put strike prices on the x and y axis, while showing TWR on the z axis. They use data from 2007-2009 with stop-loss fixed at 20. Each of the charts corresponds to a single trading day between 39 to 44 days before expiration.
39 days before expiration:
42 days before expiration:
43 days before expiration:
44 days before expiration:
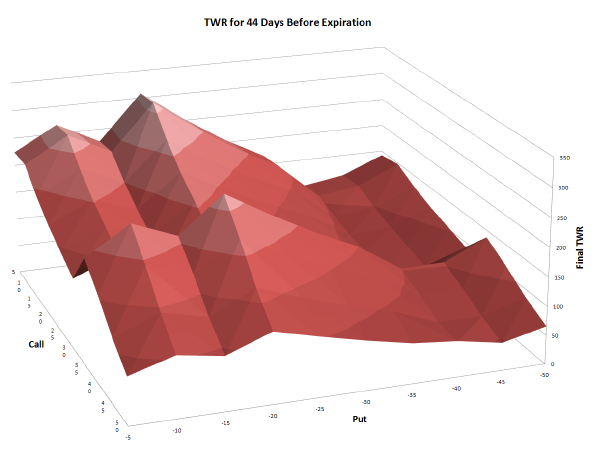
On average, strangles sold 42 days before expiration have the best performance and strangles sold 43 days before expiration have the worst performance. The top three days to sell strangles all have hot spots around call strike +5 to +10 and put strike around -15 to -20. 38 and 44 days before expiration also have hot spots at the same call strike, with lower put strikes around -30. Strangles sold 43 days before expiration on average, have much lower payoffs than the other three trading dates, and also has significantly different hot spot with call strike around +15 and put strike around -40.
Volatility Driven Decision Making
One modification was to stop trading when S&P 500 volatility is greater than a maximum acceptable value. The following histogram summarizes strategy performance by TWR for maximum volatility of 30, maximum volatility of 50, and no maximum volatility.
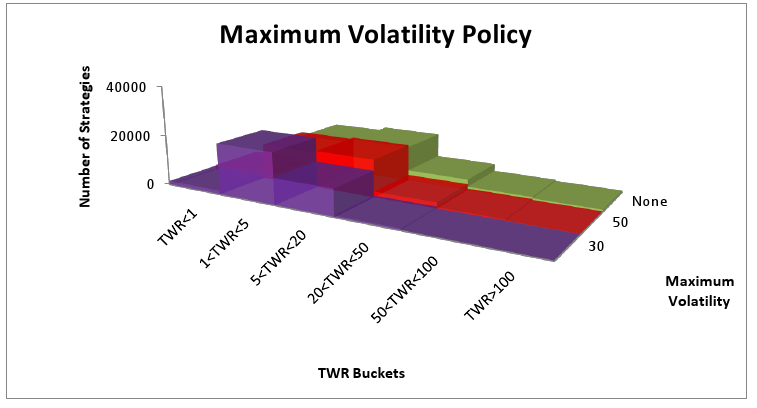
The previous graph clearly shows that always trading results in better final TWR than any limit on maximum volatility. The performance decreases as the maximum volatility policy becomes stricter. Using maximum volatility of 50 results in lost trades and lost profits but there are still more than 50% of trades available for all strategies. Using maximum volatility of 30 causes 680 strategies to become sparse, less than 50% of trades are available over the three year period.
For more on results and sensitivity analysis, see our final report.