Work Measurement Program
Food Safety Inspection Service (FSIS)
George Mason University

Additional Analysis
In addition to the basic analysis of the indirect multiplier, the GMU team hypothesized that one or more of the following parameters might impact the inspection times:
- Plant Size vs. Inspection Time
- N=60 vs. 2lb Grab vs. Inspection Time
- Measurement Team Size vs. Inspection Time
- District vs. Inspection Time
- Connection Type vs. Inspection Time
Analysis Methods
These hypotheses were assessed through analysis of the data received during the study. Two analysis methods were used, which are described below.
ANOVA
ANOVA, or ANalysis Of VAriance, is a statistical tool used to determine if a given parameter has any impact on the results of a data set. Variance is the square of standard deviation, which is the average amount of difference from the mean. The variance of the total data set ("expected variance") is compared to the calculated variance between subsets of the total data set ("found variance"). Subsets are selected by grouping the data based on a single model variable. The ratio of the expected variance to the found variance is the F-ratio. An F-ratio close to one indicates that the chosen variable under consideration is not likely to influence the results of the data. An F-ratio not close to one indicates that the chosen variable is likely to influence the results of the data. The size of that likelihood is reported in terms of the P-value. A P-value of 0.05 or less indicates that the variable did influence the data. A P-value of greater than 0.05 means that the variable did not influence the results of the data.
T-test
A t-test is conducted to determine whether one set of data is statistically different than another. A t-test allows for an inference (or judgement) to be made regarding the differences between sets of data. There are several assumptions made during the t-test analysis. First, both sets of data are assumed to be of normal distribution. For this analysis, there is also the assumption that the variances of two data sets are not assumed equal.
Results
The results of the ANOVA and T-Test analysis performed on each of the parameters is summarized in the table below. It was determined that only two parameters had an influence on direct times, and that indirect times were independent of all parameters.
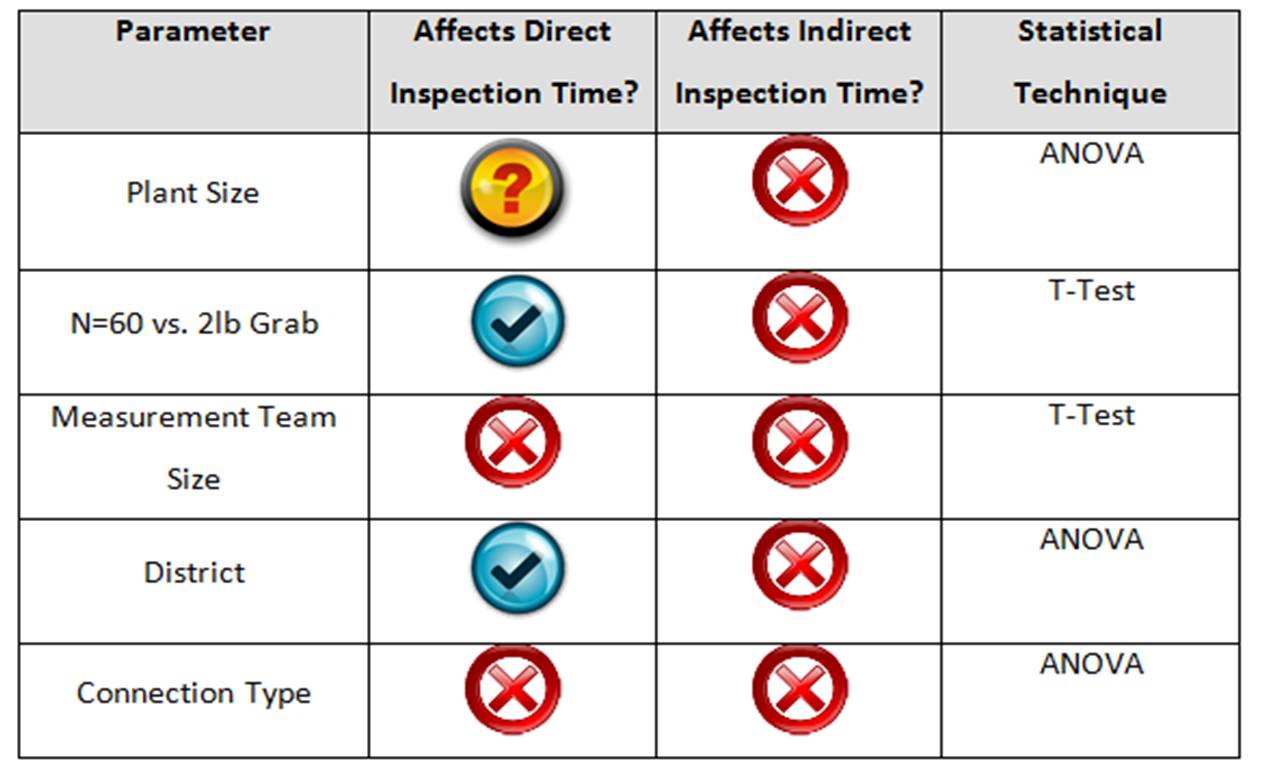 |
| Summary of Parameter vs. Inspection Time Impacts |