USDA Food Safety & Inspection Service
N60 Work Measurements Time Study
George Mason University


Our Data Analysis
The first step in our data analysis was to plot all of our received data points with respect to their individual direct and indirect times to see if there was a relationship between the two values.
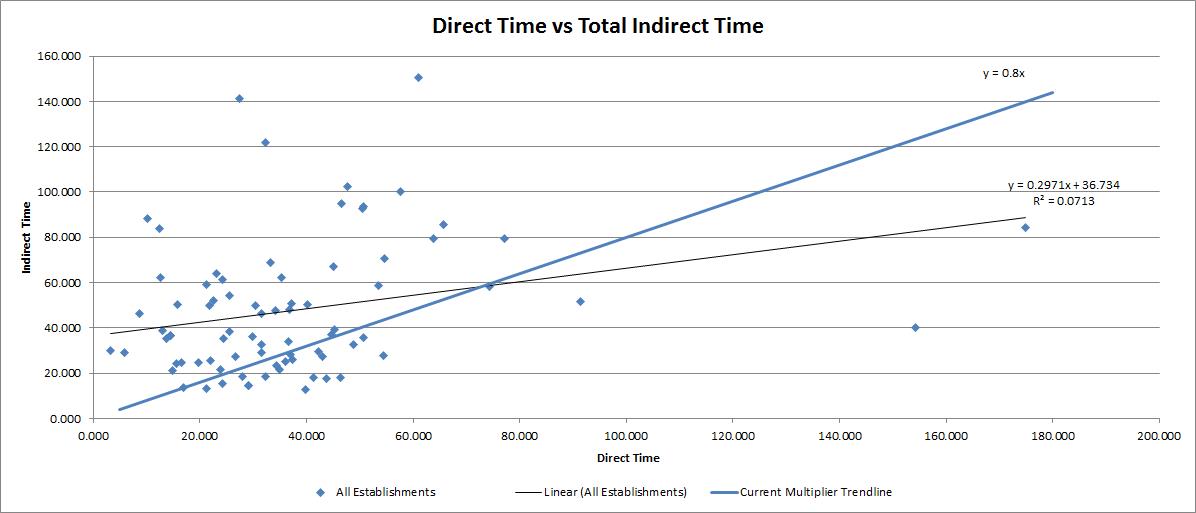
From the graph, we see that there is no evident pattern between the direct and indirect time and that the data points do not follow the 0.8 multiplier line which is currently used by FSIS. A linear line of best fit was calculated, however it also only had a R Square value of 7% implying that the linear regression explains very little variability. However, it is important to note that the slope and intercept of the best fit line were statistically significant, implying there is some relationship between direct and indirect times.
Because of this initial finding, our team decided to conduct a more in-depth analysis of the multiple data points which were collected in the data collection sheet. With the further analysis, our team hoped to find patterns in the data which would further assist FSIS in editing their indirect multiplier. Some data points include (1) inspector experience, (2) establishment HAACP size, and (3) internet connection speed.
Please look at the data analysis spreadsheet and the final report for a more in-depth view of the additional analysis conducted.