QGIS Video of Simulation
The GIS model is a visualization of the team’s localization results. It aid in understanding how the model works. The model shows the parade spectators on the west-side sidewalk from the corner of Central Park West and 75th Avenue to the corner of Central Park West and 74th Avenue and the parade participants in the Avenue from the corner of Central Park West and 75th Avenue to the corner of Central Park West and 74th Avenue. The localization model writes an output of sensor detections, source position, and source estimation that is plotted over a Google Maps overlay within Quantum GIS. Using the Quantum GIS experimental plug-in, Time Manager, the model visualizes and mobilizes the location of the above outputs over 30 steps (or seconds) of time, creating the effect that the source, source detects, and parade are mobile. The model is set to estimate localization at the Macy’s Thanksgiving Day Parade around 10:04 AM, over 30 seconds, assuming that one step is tantamount to one second of time. From this model, the team created a video of this time period to visually understand the model and base-case parameters.
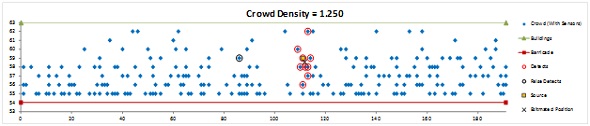
The green dots represent the parade participants. The blue dots represent the crowd viewing the parade. The yellow square is the source. The white circles represent the sensors which are detecting something (which in the base case, as shown in this video, is the source) and will be used by model to estimate the source's position.